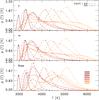
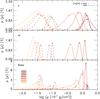
Fig. 6

Histograms of the temperature (left) and density (right panel) distributions taken at ⟨log τRoss⟩ = −4.0. We show the histograms averaged on constant geometrical height (top), column mass density (middle), and Rosseland optical depth (bottom). The surface gravity of displayed models is log g = 4.5 and the metallicity is solar (dashed lines) and subsolar with [Fe / H] = −3.0 (solid lines). The mean values are indicated by filled and open circles for [Fe / H] = −3.0 and 0.0, respectively.
Current usage metrics show cumulative count of Article Views (full-text article views including HTML views, PDF and ePub downloads, according to the available data) and Abstracts Views on Vision4Press platform.
Data correspond to usage on the plateform after 2015. The current usage metrics is available 48-96 hours after online publication and is updated daily on week days.
Initial download of the metrics may take a while.