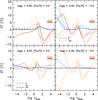
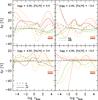
Fig. 1

Relative differences in the temperature (left) and density (right panel) stratification vs. the (averaged) Rosseland optical depth for various stellar parameters. The differences are relative to the Rosseland optical depth, i.e.  . Orange/brown dashed lines: averages on layers of constant geometrical height ⟨3D⟩z; orange/brown dotted lines: averages on layers of constant column mass density ⟨3D⟩m; orange/brown solid lines: 1D MLT models. Blue solid lines: flux-weighted T4-stratifications; blue dashed lines: brightness temperatures Trad averaged on surfaces of constant Rosseland optical depth (left panel). Green solid lines: logarithmic density averages
  ; green dashed lines: hydrostatic averages
  (right panel). We compare always cooler and hotter effective temperatures, which are distinguished by dark and bright colors respectively. We note that the cool metal-poor dwarfs exhibit very small differences, and are therefore indistinguishable. Note the differences in the y-axes.
Current usage metrics show cumulative count of Article Views (full-text article views including HTML views, PDF and ePub downloads, according to the available data) and Abstracts Views on Vision4Press platform.
Data correspond to usage on the plateform after 2015. The current usage metrics is available 48-96 hours after online publication and is updated daily on week days.
Initial download of the metrics may take a while.