Fig. 9
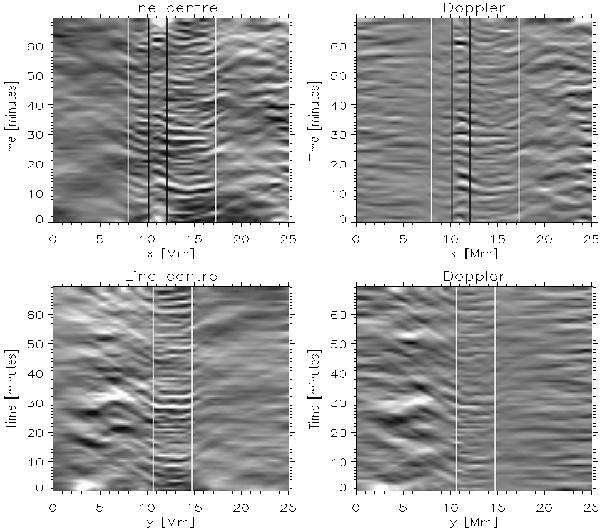
Time-slices showing umbral flashes and running waves observed in difference maps (unfiltered − filtered) of the Ca II line-centre intensity (left) and Doppler velocity (right). The slices are constructed along the cuts in x (top) and y (bottom) directions displayed in Fig. 5. White lines mark edges of the umbra, black lines the borders of the light bridge. The grey scale of Doppler velocities ranges from −2 to 2 km s-1.
Current usage metrics show cumulative count of Article Views (full-text article views including HTML views, PDF and ePub downloads, according to the available data) and Abstracts Views on Vision4Press platform.
Data correspond to usage on the plateform after 2015. The current usage metrics is available 48-96 hours after online publication and is updated daily on week days.
Initial download of the metrics may take a while.