Fig. 5
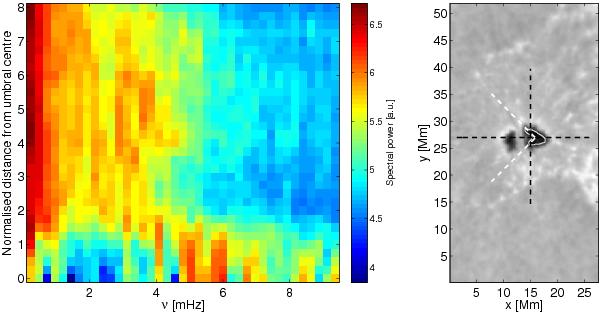
Azimuthally averaged power spectra of the Ca II line-centre intensity as a function of the normalised radial distance from the pore’s centre and frequency (left) and a sketch of geometry used (right). The solid line encircles the safe boundary of the pore (see text). The radial distance is normalised with respect to this boundary (here R ≡ 1 for all angles). Two white dashed lines limit the angles used in the azimuthal average of the power spectra. The black dashed lines mark the cuts in x and y used to construct time-slice diagrams in Fig. 9.
Current usage metrics show cumulative count of Article Views (full-text article views including HTML views, PDF and ePub downloads, according to the available data) and Abstracts Views on Vision4Press platform.
Data correspond to usage on the plateform after 2015. The current usage metrics is available 48-96 hours after online publication and is updated daily on week days.
Initial download of the metrics may take a while.