Free Access
Fig. 4
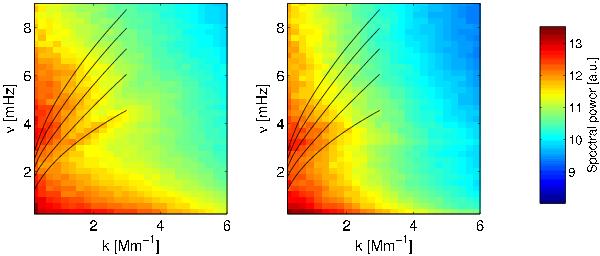
Comparison of k–ω diagrams obtained for the quiet-Sun region, constructed for the wings of the Ca II line (left) and the centre of the line (right). Model S eigenfrequencies are overplotted with solid lines.
Current usage metrics show cumulative count of Article Views (full-text article views including HTML views, PDF and ePub downloads, according to the available data) and Abstracts Views on Vision4Press platform.
Data correspond to usage on the plateform after 2015. The current usage metrics is available 48-96 hours after online publication and is updated daily on week days.
Initial download of the metrics may take a while.