Fig. 3
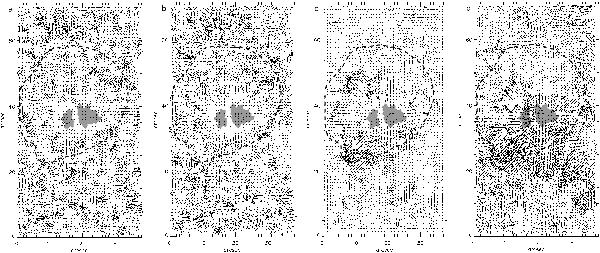
Horizontal velocities of intensity and Doppler structures, integrated over a time interval of 52 min. From left to right: a) broad-band (WL) around 621 nm, b) Ca II 854.2 nm blue (−60 pm) wing, c) Ca II line centre, and d) Doppler structures. The black dashed line outlines the border of the chromospheric filamentary structure. The black bars at the beginning of the x-axis correspond to 1 km s-1 (note that their length is three times longer for (a),b) than for (c),d)).
Current usage metrics show cumulative count of Article Views (full-text article views including HTML views, PDF and ePub downloads, according to the available data) and Abstracts Views on Vision4Press platform.
Data correspond to usage on the plateform after 2015. The current usage metrics is available 48-96 hours after online publication and is updated daily on week days.
Initial download of the metrics may take a while.