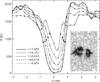
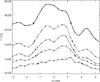
Fig. 10

Profiles of magnetic-field strength B (left) and temperature T (right) across the light bridge at different optical depths τ500, obtained by inverting HINODE observations. The location of the cut is shown in the inset. Crosses denote data points obtained by the inversion code and black squares the positions used to measure the width.
Current usage metrics show cumulative count of Article Views (full-text article views including HTML views, PDF and ePub downloads, according to the available data) and Abstracts Views on Vision4Press platform.
Data correspond to usage on the plateform after 2015. The current usage metrics is available 48-96 hours after online publication and is updated daily on week days.
Initial download of the metrics may take a while.