Fig. 6
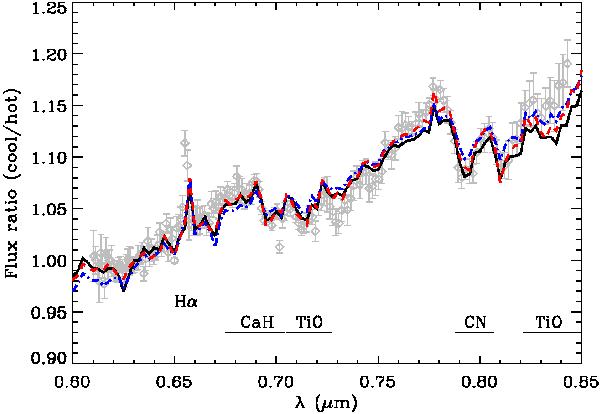
Flux ratio for the Capella binary as a function of wavelength as measured with FIRST (gray diamonds). All curves represent predicted flux ratio spectra based on the PHOENIX grid of models and the set of solar abundances from Asplund et al. (2009). The blue dot-dashed curve shows the predicted flux ratio spectrum for the stellar parameters inferred by Torres et al. (2009), while the solid black curve represents the formal best fit (in the χ2 sense) to the flux ratio spectrum from the solar metallicity model grid. The red dashed curve shows the best fit for the model grid for a metallicity of [m/H] = + 0.5. Stellar parameters for all three models are listed in Table 5. The main atomic and molecular features that drive the model fitting are identified.
Current usage metrics show cumulative count of Article Views (full-text article views including HTML views, PDF and ePub downloads, according to the available data) and Abstracts Views on Vision4Press platform.
Data correspond to usage on the plateform after 2015. The current usage metrics is available 48-96 hours after online publication and is updated daily on week days.
Initial download of the metrics may take a while.