Fig. 3
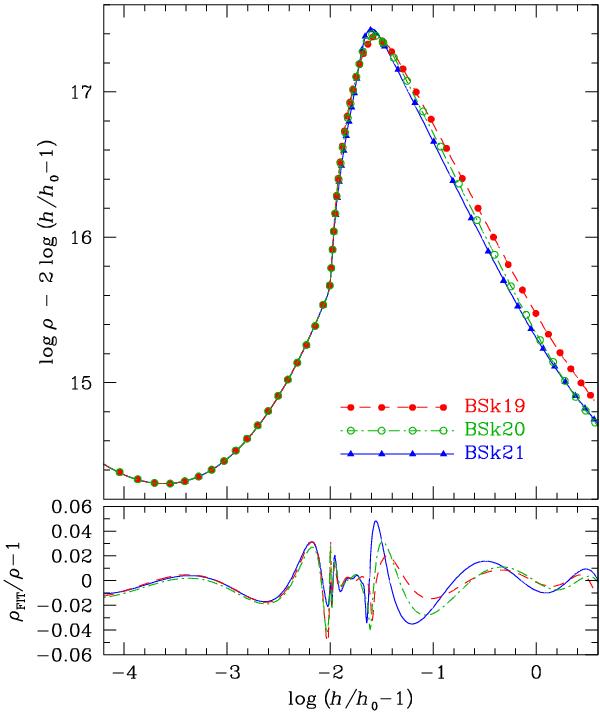
Mass density as a function of pseudo-enthalpy. Upper panel: rarefied data to be fitted, calculated by integration according to Eqs. (2) and (3) (symbols), compared with the fit (8) (lines). Lower panel: fractional difference between the data and fit. The symbols and line styles for BSk19, BSk20, and BSk21 are the same as in Fig. 2.
Current usage metrics show cumulative count of Article Views (full-text article views including HTML views, PDF and ePub downloads, according to the available data) and Abstracts Views on Vision4Press platform.
Data correspond to usage on the plateform after 2015. The current usage metrics is available 48-96 hours after online publication and is updated daily on week days.
Initial download of the metrics may take a while.