Fig. 2
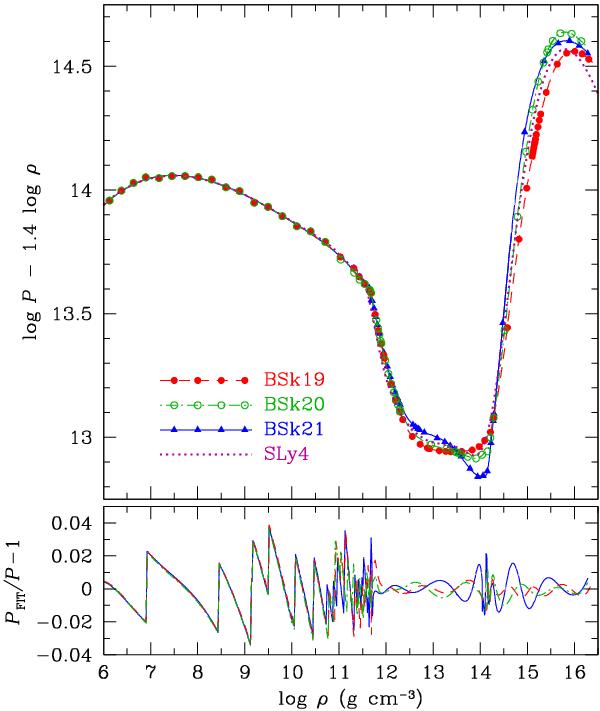
Comparison of the data and fits for the pressure as a function of mass density for the EoS models BSk19, BSk20, and BSk21. Upper panel: rarefied tabular data (symbols) and the fit (3) (lines); lower panel: relative difference between the data and fit. Filled dots and dashed lines: BSk19; open circles and dot-dashed lines: BSk20; filled triangles and solid lines: BSk21. For comparison, the dotted line in the upper panel reproduces the fit to the EoS SLy4 (Haensel & Potekhin 2004).
Current usage metrics show cumulative count of Article Views (full-text article views including HTML views, PDF and ePub downloads, according to the available data) and Abstracts Views on Vision4Press platform.
Data correspond to usage on the plateform after 2015. The current usage metrics is available 48-96 hours after online publication and is updated daily on week days.
Initial download of the metrics may take a while.