| Issue |
A&A
Volume 559, November 2013
|
|
|---|---|---|
| Article Number | A91 | |
| Number of page(s) | 7 | |
| Section | Cosmology (including clusters of galaxies) | |
| DOI | https://doi.org/10.1051/0004-6361/201322535 | |
| Published online | 20 November 2013 | |
Limits on the spatial variations of the electron-to-proton mass ratio in the Galactic plane⋆
1
Hamburger Sternwarte, Universität Hamburg, Gojenbergsweg 112, 21029
Hamburg, Germany
e-mail: lev@astro.ioffe.rssi.ru
2
Ioffe Physical-Technical Institute, Polytekhnicheskaya Str. 26, 194021
St. Petersburg,
Russia
3
St. Petersburg Electrotechnical University “LETI”,
Prof. Popov Str. 5,
197376
St. Petersburg,
Russia
4
Max-Planck-Institut für Radioastronomie,
Auf dem Hügel 69, 53121
Bonn,
Germany
5
Astronomy Department, King Abdulaziz University,
PO Box 80203, 21589
Jeddah, Saudi
Arabia
6
INAF – Istituto di Radio Astronomia, via P. Gobetti
101, Bologna, Italy
7
INAF – Osservatorio Astronomico di Trieste,
via Tiepolo 11, 34131
Trieste,
Italy
8
Centro de Astrofsica, Universidade do Porto,
Rua das Estrelas, 4150-762
Porto,
Portugal
Received: 26 August 2013
Accepted: 7 October 2013
Aims. We aim to validate the Einstein equivalence principle (local position invariance) by limiting the fractional changes in the electron-to-proton mass ratio, μ = me/mp, measured in Galactic plane objects.
Methods. High-resolution spectral observations of dark clouds in the inversion line of NH3(1, 1) and pure rotational lines of other molecules (the so-called ammonia method) were performed at the Medicina 32-m and the Effelsberg 100-m radio telescopes to measure the radial velocity offsets, ΔRV = Vrot − Vinv, between the rotational and inversion transitions, which have different sensitivities to the value of μ.
Results. In our previous observations (2008–2010), a mean offset of ⟨ΔRV⟩ = 0.027 ± 0.010 km s-1 (3σ confidence level (C.L.)) was measured. To test for possible hidden errors, we carried out additional observations of a sample of molecular cores in 2010–2013. As a result, a systematic error with an amplitude ~0.02 km s-1 in the radial velocities was revealed. The averaged offset between the radial velocities of the rotational transitions of HC3N(2–1), HC5N(9–8), HC7N(16–15), HC7N(21–20), and HC7N(23–22), and the inversion transition of NH3(1, 1) is ⟨ΔRV⟩ = 0.003 ± 0.018 km s-1 (3σ C.L.). This value, when interpreted in terms of Δμ/μ = (μobs − μlab)/μlab, constraints the μ-variation at the level of Δμ/μ < 2 × 10⁻⁸ (3σ C.L.), which is the most stringent limit on the fractional changes in μ based on astronomical observations.
Key words: line: profiles / ISM: molecules / radio lines: ISM / techniques: radial velocities / elementary particles
© ESO, 2013
1. Introduction
This study is aimed at testing whether the dimensionless physical constant, the electron-to-proton mass ratio, μ = me/mp, is really constant, or whether it varies with space and time. The latter would imply, at some level, a violation of the Einstein equivalence principle (EEP), that is, local position invariance (LPI) and local Lorentz invariance (LLI), as suggested in a number of unification theories (for reviews, see, e.g., Uzan 2011; Liberati 2013). In particular, a changing fine-structure constant, α = e2/ħc, accompanied by variation in other coupling constants can be associated with a violation of LLI (Kostelecký et al. 2003). LPI, on the other hand, postulates that the outcome of any local nongravitational experiment is independent of where and when it is performed, that is, that the fundamental physical laws are space-time invariant.
Experimental validation of EEP is, therefore, one of the pillars of the Standard Model (SM) of particle physics, allowing us to probe the applicability limits of the SM in testing the most accurate theories, such as quantum electrodynamics and/or in searching for new types of interactions. At the same time, precision limits delivered from these experiments serve as restrictions for the numerous new theories beyond the SM and can help to distinguish between them.
Two coupling constants in question are of particular interest for astrophysical experiments
since their fractional changes
Δμ/μ = (μobs − μlab)/μlab,
and
Δα/α = (αobs − αlab)/αlab
can be measured accurately from spectra of Galactic and extragalactic sources. Because the
fine-structure constant sets the scale of the electromagnetic interaction, experiments in
which electrons interact with electromagnetic fields (e.g., forming atomic and molecular
spectra in this way) can be used to determine α. The electron-to-proton
mass ratio is known to define the vibrational ( ) and rotational
(Erot ∝ μ) frequencies of molecular spectra.
On the other hand, the electron mass me is related to the vacuum
expectation value of the Higgs field (i.e., the scale of the weak nuclear force), and
mp – to the quantum chromodynamics energy scale (i.e., the
strong nuclear force). Therefore, molecular transitions can be used to determine
μ and thus the ratio between weak and strong nuclear forces.
) and rotational
(Erot ∝ μ) frequencies of molecular spectra.
On the other hand, the electron mass me is related to the vacuum
expectation value of the Higgs field (i.e., the scale of the weak nuclear force), and
mp – to the quantum chromodynamics energy scale (i.e., the
strong nuclear force). Therefore, molecular transitions can be used to determine
μ and thus the ratio between weak and strong nuclear forces.
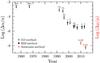 |
Fig. 1 Astronomical constraints on α- and μ-variations (1σ C.L.) for the period from 1956 to 2013. Above each point, the spectral resolution (FWHM in km s-1) is indicated. α-variation constraints are based on the alkali-doublet (AD) and many-multiplet (MM) methods applied to extragalactic targets, whereas the μ-variation is based on the ammonia method (Galactic targets). The data points for the AD method are taken from Savedoff (1956), Bahcall et al. (1967), Levshakov (1992), Varshalovich & Potekhin (1995), Varshalovich et al. (1996), Murphy et al. (2001), and Chand et al. (2005); for the MM method they are taken from Webb et al. (1999), Quast et al. (2004), Srianand et al. (2007), Agafonova et al. (2011), and Molaro et al. (2013); for the ammonia method they are taken from Paper II (red circle), and the current value (red dot). The figure shows that limits on the α- and μ-variations just follow the spectral resolution approximately as Δα/α (or Δμ/μ) ∝ 1/10th of the pixel size. |
In spite of some claims of marginal detections of changes in either α or μ at high redshifts, none have been confirmed through independent observations. As shown in Fig. 1, the most precise constraints on Δα/α and Δμ/μ based on astronomical spectra just follow the available spectral resolution. Up to now, no signals have yet been detected in the range of fractional changes from ~3 × 10⁻² to ~3 × 10⁻⁸. Thus, any progress in improving the existing limits can be achieved from observations of narrow spectral lines involving higher spectral resolutions to resolve their profiles completely. At the moment, the resolution of radio telescopes exceeds that of optical facilities by order(s) of magnitude; an additional and very attractive property of microwave radio observations is that some molecular transitions from this frequency range are extremely sensitive to the putative variations of the fundamental physical constants (for a review see, e.g., Kozlov & Levshakov 2013).
In 2007, Flambaum & Kozlov proposed the so-called ammonia method to test the variability of μ. It compares the relative shifts between the inversion transition of NH3(1, 1) and pure rotational transitions of other molecules tracing closely the ammonia spatial distribution. The sensitivity coefficient, Qinv, of the inversion transition to the μ-variation is 4.46 times higher than that of the rotational transition (Qrot = 1). Using this method for a sample of cold molecular cores from the Galactic plane, we obtained the following estimates of the spatial μ-variations: Δμ/μ = (1.3 ± 0.8stat ± 0.3sys) × 10-8 [1σ confidence level (C.L.)] with the Medicina 32-m telescope (Levshakov et al. 2010a, Paper I), and Δμ/μ = (2.6 ± 0.1stat ± 0.3sys) × 10-8, based on observations with the Effelsberg 100-m telescope (Levshakov et al. 2010b, Paper II). The given systematic errors are dominated by uncertainties of the rest frame frequencies of the observed molecular transitions. However, these measurements have been carried out at the highest sensitivity available (maximum performance) and, thus, the true systematic error can be in fact larger because of potentially inherent instrumental errors. A quantitative assessment of this uncertainty is not a straightforward procedure and requires in general both a special design of measurements and a cross-checking of results obtained with different instruments. To provide such an assessment we repeated observations of the same targets, employing spectrometers with spectral resolutions, which are different from those previously used. Additionally, we performed a set of measurements at the Effelsberg telescope to obtain a more detailed characteristic of instrumental instabilities that may affect the values of line radial velocities. Here we present the results.
2. Observations
Source positions and radial velocities.
The following molecular transitions were observed towards cold (Tkin ~ 10 K) and dense (nH2 ~ 104 cm-3) starless molecular cores from the Galactic plane listed in Table 1: NH3 (J,K) = (1, 1) 23.7 GHz, HC3N (J = 2–1) 18.2 GHz, HC5N (J = 9–8) 23.9 GHz, HC7N (J = 16–15) 18.0 GHz, HC7N (J = 21–20) 23.7 GHz, and HC7N (J = 23–22) 25.9 GHz. We used the Medicina 32-m and the Effelsberg 100-m radio telescope as described in Papers I and II, and in Levshakov et al. (2013).
In November 2010, cores L1512 and L1498 were re-observed with the 32-m Medicina telescope using the high-resolution digital spectrometer MSpec0 with a channel separation of 0.494 kHz (8192 channels). This corresponds to Δch = 0.006 km s-1 at the position of the ammonia inversion transition NH3(1, 1). For comparison, observations of core L1512 in 2008 with the digital spectrometer ARCOS (ARcetri COrrelation Spectrometer) had Δch = 0.062 km s-1 (Paper I). The angular resolutions at the frequencies of the NH3(1, 1) and HC3N(2–1) lines were 1.6′ and 2.1′, respectively. The observations were performed in position-switching mode (PSW). The rms pointing uncertainty was ≲25′′.
Observations in 2011–2013 with the Effelsberg 100-m telescope targeted a sample of nine cores from Table 1. The source coordinates were taken from Paper I and Levshakov et al. (2013), except for L1498A, for which they were estimated from Fig. 3 in Kuiper et al. (1996). The source L1498A is a gas condensation within the L1498 dark cloud separated by 2′ from the NH3 reference position.
In 2011, the measurements were obtained in the frequency-switching (FSW) mode using a frequency throw of ±2.5 MHz. The backend was a fast Fourier-transform spectrometer (FFTS), operated with a bandwidth of 20 MHz, which simultaneously provided 16 384 channels for each polarization. The resulting channel width was Δch = 0.015 km s-1. However, the true velocity resolution is about 1.6 times coarser.
In 2012–2013, we performed the measurements in the PSW mode with the backend XFFTS (eXtended bandwidth FFTS) operating with 100 MHz bandwidth and providing 32 768 channels for each polarization. The resulting channel width was Δch = 0.039 km s-1, but the true velocity resolution is 1.16 times lower (Klein et al. 2012).
3. Results
The spatial distribution of the molecular cores in Galactic coordinates are shown in Fig. 2. The cores are located towards both the Galactic center and anti-center, at distances 100 pc ≲D ≲ 300 pc from the Sun, and close to the Galactic equator, −19°< b < 15°. The selected sources are known to have narrow molecular emission lines (full width at half maximum, FWHM < 1 km s-1), which makes them the most suitable targets for precise measurements of relative radial velocities (RV). At first, we consider the results obtained at Effelsberg, then those at Medicina.
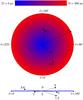 |
Fig. 2 Schematic location of the observed molecular cores in projection onto the Galactic plane and equator. The Galactic center longitude is ℓ = 0°, by definition. The distance scale is given by the wedge at the top of the figure. Numbers mark sources from Table 1. |
3.1. Effelsberg observations
Radial velocities, VLSR, linewidths (FWHM), Δv, and velocity offsets, ΔRV = Vrot − Vinv, measured with the Effelsberg 100-m and the Medicina 32-m telescopes.
To verify the reproducibility of the relative RVs of the NH3(1, 1) and HC3N(2–1) lines we re-observed the two molecular cores L1512 and L1498 in 2011. The procedure was the same as during the 2010 observations, that is, cores were mapped at the same offsets and in the same lines: in the (1, 1) inversion transition of NH3 complemented by rotational lines of other molecular species.
Line parameters such as the total optical depth in the transition, τ,
the radial velocity, VLSR, the linewidth, Δv,
and the amplitude,  ,
were estimated by fitting a one-component Gaussian model to the observed spectra. The
model was defined by Eqs. ((8)–(10)) in Paper I. Since we are mostly interested in the
model parameters VLSR and Δv, their values
are listed in Table 2. Given in parentheses are the
1σ errors of VLSR and, directly below,
Δv obtained from the diagonal elements of the covariance matrix
calculated for the minimum of χ2. The last column presents the
differences
ΔRV = Vrot − Vinv
between the radial velocities of the rotational lines and the inversion (1, 1) line of
NH3, as well as their 1σ errors (numbers in parentheses).
The offsets ΔRV provide a sensitive limit to the variation of
μ (Flambaum & Kozlov 2007):
,
were estimated by fitting a one-component Gaussian model to the observed spectra. The
model was defined by Eqs. ((8)–(10)) in Paper I. Since we are mostly interested in the
model parameters VLSR and Δv, their values
are listed in Table 2. Given in parentheses are the
1σ errors of VLSR and, directly below,
Δv obtained from the diagonal elements of the covariance matrix
calculated for the minimum of χ2. The last column presents the
differences
ΔRV = Vrot − Vinv
between the radial velocities of the rotational lines and the inversion (1, 1) line of
NH3, as well as their 1σ errors (numbers in parentheses).
The offsets ΔRV provide a sensitive limit to the variation of
μ (Flambaum & Kozlov 2007):
![$$ {\Delta \mu}{/}{\mu} = (V_{\rm rot} - V_{\rm inv}){/}[(Q_{\rm inv} - Q_{\rm rot})c] \approx 0.3\Delta V/c, $$](/articles/aa/full_html/2013/11/aa22535-13/aa22535-13-eq93.png) where c is the speed of
light, and Qinv,Qrot are the
corresponding sensitivity coefficients to changes in μ.
where c is the speed of
light, and Qinv,Qrot are the
corresponding sensitivity coefficients to changes in μ.
The RVs measured in 2010 (Paper II) and 2011 at different radial distances along the main diagonal cuts towards L1512 and L1498 are shown in Fig. 3. The velocity offsets ΔRV exhibit quite a different behavior in these two years: at the same positions the changes of ΔRV considerably exceed its uncertainty interval (≲0.003 km s-1, see Figs. 3 and 4 in Paper II), which is probably caused by unknown systematic errors.
To determine the source of these errors, we performed in 2012 a set of continuous observations of L1512 and L1498 targeting their ammonia peaks. Observing in PSW mode, we also used different OFF positions (for L1512) to search for possible contamination from a putative extended background ammonia emission (which was not detected). The resulting time series are shown in Fig. 4. The exposure time of each subscan was 150 s. The RV values fluctuate with an amplitude of ≈±0.01 km s-1, that is, ≈1/4th of the channel width.
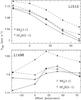 |
Fig. 3 Line-of-sight velocities (VLSR) of NH3 (J,K) = (1, 1) (squares) and HC3N J = 2–1 (triangles) along the main diagonal cuts towards the molecular cores L1512 and L1498 measured in 2010 (dashed lines) and in 2011 (solid lines) at the Effelsberg 100-m radio telescope. The half-power beam width at 23 GHz is 40′′ (50′′ at 18 GHz), the backend is the fast Fourier-transform spectrometer (FFTS) with a channel separation Δch = 0.015 km s-1 (0.020 km s-1 at 18 GHz). |
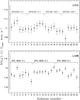 |
Fig. 4 Line-of-sight velocities (VLSR) of the NH3(1, 1) transition (dots with 1σ error bars) towards the ammonia peaks in the molecular cores L1512 and L1498 measured continuously in the PSW mode at the Effelsberg 100-m radio telescope in April, 2012. The exposure time at each point is 150 s. The position-switching offsets are shown in parentheses. The backend was an extended fast Fourier-transform spectrometer (XFFTS) with a channel separation Δch = 0.039 km s-1 (marked by vertical lines). Random shifts of the VLSR values are revealed with an amplitude ≃ ±0.01 km s-1 (i.e., ≃1/4th of the channel width). |
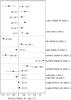 |
Fig. 5 Radial velocity differences, Δ RV, between rotational transitions of different molecules and the NH3(1, 1) inversion line for the sources observed at the Effelsberg 100-m telescope (2011–2013). 1σ statistical errors are indicated. The coordinate offsets in arcsec are given in parentheses. Filled circles are for data from this paper; open triangle, square, and circle are for data from Papers I and II. |
In our observations, the sky frequencies were reset at the onset of each subscan. Therefore, the longer a subscan, the higher the error caused by Doppler shifts during the exposure time (e.g., for a 5 min scan, it is about 0.004 km s-1 at Effelsberg latitude). We corrected some of our observations to account for residual Doppler shifts. This did not lead to a significant change in the results, however.
To determine whether the sky frequency is identical with the frequency coming out of the backend we carried out a test with an artificial signal at 22 000.78 125 MHz. The synthesizer frequency was accurate to about 1 Hz, and the frequency scale was found to be accurate to about 32 Hz (≈0.0004 km s-1).
Another source of errors that can affect the Δμ/μ estimates with the ammonia method is the possible segregation of molecules in molecular cores, which gives rise to systematic shifts of RVs. Figure 5 shows the ΔRV offsets measured in 2013 (filled circles) towards eight molecular cores at different positions indicated in Col. 2 of Table 2 and Cols. 3 and 4 of Table 1. Previous ΔRV values, obtained in 2009–2011, are marked by open symbols. A spread of the velocity offsets ΔRV is clearly seen.
Thus, we conclude that noise in the ΔRV values consists of at least two components. One is due to chemical differentiation and velocity gradients within the molecular cores, possibly amplified by small variations in the telescope pointing. The other may originate from the different optical depths of the hyperfine structure transitions, which may lead to some scatter in the RVs. However, all these effects may act in opposite directions from one observation to another, and, because they are averaged over a sample of targets, should be reduced to some extent. Applied to our sample shown in Fig. 5 (n = 19 independent offsets ΔRV), this gives a weighted mean ⟨ΔRV⟩ = 0.003 ± 0.018 km s-1 (3σ C.L.). When interpreted in terms of Δμ/μ = (μobs − μlab)/μlab, this value of ⟨ΔRV⟩ constrains the μ-variation at the level of Δμ/μ < 2 × 10⁻⁸ (3σ C.L.), which is the most stringent limit on the spatial variation of μ based on radio astronomical observations.
We note in passing that mapping of the dense molecular cores in different molecular lines shows that there is, in general, a good correlation between the NH3, N2H+, and HC3N distributions (Fuller & Myers 1993; Hotzel et al. 2004; Tafalla et al. 2004; Pagani et al. 2009). However, in some clouds NH3 is not traced by HC3N, for instance, in the dark cloud TMC-1, where peaks of emission lines are offset by 7′ (Olano et al. 1988). In our case, we observe systematic velocity shifts between NH3 and other species. This is expected since C-bearing molecules are usually distributed in the outer layers of the cores rich in depletion-sensitive molecules, whereas N-bearing molecules, which are depletion-resistant species, trace the inner cores (examples are given in, e.g., Tafalla et al. 2006).
3.2. Medicina observations
The NH3(1, 1) and HC3N(2–1) lines towards the cores L1512 and L1498
are among the narrowest molecular lines known in the interstellar medium. The observed
FWHM linewidths of the completely resolved hyperfine components, the
 line of NH3(1, 1) and the
F′ → F = 3 → 2 transition of HC3N(2–1), are
Δv = 0.19 km s-1 and 0.16 km s-1, respectively.
The NH3 and HC3N spectra are shown in Figs. 6 and 7. The hyperfine components
show no kinematic substructure and consist of an apparently symmetric peak profile without
broadened line wings or self-absorption features. In cores L1512 and L1498, the NH3
hyperfine satellite lines with ΔF1 ≠ 0 are optically thin,
τ < 1, whereas the main transitions with
ΔF1 = 0 are slightly saturated, τ ≳ 1
(Paper II). However, we did not find significant differences between the RVs of the main
and satellite lines (see Tables 2 and 3 in Paper II). The optical depth of the strongest
hyperfine transition F′ → F = 3 → 2 of
HC3N(2–1) is 0.67 (L1498) and 0.35
(L1512).
line of NH3(1, 1) and the
F′ → F = 3 → 2 transition of HC3N(2–1), are
Δv = 0.19 km s-1 and 0.16 km s-1, respectively.
The NH3 and HC3N spectra are shown in Figs. 6 and 7. The hyperfine components
show no kinematic substructure and consist of an apparently symmetric peak profile without
broadened line wings or self-absorption features. In cores L1512 and L1498, the NH3
hyperfine satellite lines with ΔF1 ≠ 0 are optically thin,
τ < 1, whereas the main transitions with
ΔF1 = 0 are slightly saturated, τ ≳ 1
(Paper II). However, we did not find significant differences between the RVs of the main
and satellite lines (see Tables 2 and 3 in Paper II). The optical depth of the strongest
hyperfine transition F′ → F = 3 → 2 of
HC3N(2–1) is 0.67 (L1498) and 0.35
(L1512).
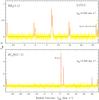 |
Fig. 6 Spectra of NH3(1, 1) and HC3N(2–1) (yellow) towards core L1512 (offset Δα,Δδ = 0′′, 0′′) obtained at the Medicina 32-m radio telescope with the high-resolution spectrometer MSpec0 (channel widths Δch = 0.006 km s-1 and 0.008 km s-1 at 23 GHz and 18 GHz, respectively). The red curves are the best-fit model spectra. The observed linewidths are Δv(NH3) = 0.19 km s-1, and Δv(HC3N) = 0.16 km s-1. |
If the two molecular transitions are thermally broadened and trace the same material, the lighter molecule NH3 should have a wider linewidth than the heavier molecule HC3N. This is precisely what is seen in Figs. 6 and 7. Thus the observed spectra from L1512 and L1498 are consistent with thermally dominated line broadening at a kinetic temperature Tkin ~ 13 K. This may indicate that the two species are sampling the same gas.
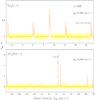 |
Fig. 7 Same as Fig. 6, but for core L1498. The observed linewidths are Δv(NH3) = 0.19 km s-1, and Δv(HC3N) = 0.16 km s-1. |
Table 2 lists the measured offsets of the NH3(1, 1) and HC3N(2–1) lines as well as their linewidths (observations with MSpec0). The measured RVs give a velocity offset ΔRV = 0.001 ± 0.009 km s-1 for L1512, and ΔRV = −0.001 ± 0.012 km s-1 for L1498, with the mean ⟨ΔRV⟩ = 0.000 ± 0.009 km s-1. The previous observations of L1512 with ARCOS (Paper I) gave the offset ΔRV = 0.018 ± 0.012 km s-1, which is slightly biased with respect to the current estimate (indicated are 3σ C.L.).
Formally, the new observations show an error of the mean ⟨ΔRV⟩ twice lower than that of the Effelsberg result. However, since only one single position was observed in both cores, we cannot evaluate the systematics of MSpec0 (like we do at Effelsberg), and on the basis of the Effelsberg experience we adopt the same limit, Δμ/μ < 2 × 10⁻⁸ (3σ C.L.), that is, we conservatively assign a bias of ~0.02 km s-1 to the possible systematic error of the Medicina dataset.
4. Limits on Δα/α
The obtained local constraint on the spatial μ-variation, Δμ/μ < 2 × 10⁻⁸ (3σ C.L.), can be used to set limits on changes in α. This is strongly model dependent, however. For example, within the grand unification theory (GUT) a variation of α would imply considerably stronger fractional changes in the mass scale of the strong force in QCD, ΛQCD, and in quark- and electron masses, leading to
 where R ~ 40 (e.g.,
Langacker et al. 2002; Flambaum et al. 2004). This gives a limit on
| Δα/α| < 10-10 (1σ
C.L.). A direct estimate of changes in α in the Milky Way, based on
observations of CH sources, sets a 1σ upper limit
| Δα/α| < 10-7 (Truppe et al. 2013).
where R ~ 40 (e.g.,
Langacker et al. 2002; Flambaum et al. 2004). This gives a limit on
| Δα/α| < 10-10 (1σ
C.L.). A direct estimate of changes in α in the Milky Way, based on
observations of CH sources, sets a 1σ upper limit
| Δα/α| < 10-7 (Truppe et al. 2013).
At higher redshifts, the most stringent constraint on cosmological
μ-variation was set at z = 0.89,
| Δμ/μ| < 10-7 (Bagdonaite et al. 2013). For R ~ 40, this would imply
that | Δα/α| < 2.5 × 10⁻⁹
(1σ C.L.) at epoch 7 × 10⁹ yr, meaning in turn that
 yr-1. At very high redshift, z = 5.2 (epoch 12.9 Gyr), the
current limit is Δα/α < 8 × 10⁻⁶
(1σ C.L.), corresponding to
yr-1. At very high redshift, z = 5.2 (epoch 12.9 Gyr), the
current limit is Δα/α < 8 × 10⁻⁶
(1σ C.L.), corresponding to  yr-1 (Levshakov et al. 2012). We recall that most stringent limits set by the
Oklo fossil reactor and by terrestrial atomic clock experiments are
yr-1 (Levshakov et al. 2012). We recall that most stringent limits set by the
Oklo fossil reactor and by terrestrial atomic clock experiments are
 yr-1 (Uzan 2011) and
 yr-1 (Rosenband et al. 2008),
respectively.
yr-1 (Rosenband et al. 2008),
respectively.
As mentioned above, the value of R is poorly constrained. Depending on the theory, it varies from −235 to +46 (see, e.g., Sect. 5.3.1 in Uzan 2011). The only way to distinguish between the theories is to measure Δα/α and Δμ/μ independently.
5. Conclusions
We have used the Medicina 32-m telescope and the Effelsberg 100-m telescope to observe the NH3(1, 1) 23.7 GHz, HC3N(2–1) 18.2 GHz, HC5N(9–8) 23.9 GHz, HC7N(16–15) 18.0 GHz, HC7N(21–20) 23.7 GHz, and HC7N(23–22) 25.9 GHz spectral lines in molecular cores devoid of associated IR sources. The principle of local position invariance (LPI) was tested in the solar vicinity (D ≲ 300 pc) by comparing the electron-to-proton mass ratio μ in different physical environments of high terrestrial (n ~ 1019 cm-3) and low interstellar (n ~ 104 cm-3) densities of baryonic matter. No statistically significant changes in μ were detected at a level of ~10-8.
The main results obtained are as follows:
-
1.
To test the reproducibility of the measurements of the relativeradial velocities between the NH3(1, 1) and HC3N(2–1) transitions observed towards dark molecular cores in 2008–2010 at the Medicina 32-m and the Effelsberg 100-m telescopes, we re-observed two clouds, L1512 and L1498, and revealed discrepancies between the ΔRV = VLSR(HC3N) − VLSR(NH3) values that are as large as the channel width, ΔRV ≲ 0.02 km s-1.
-
2.
Continuous observations of L1512 and L1498 at Effelsberg in 2012 at a fixed position towards the ammonia peaks showed that the measured radial velocity VLSR(NH3) fluctuates during the exposure time of two hours with an amplitude ≃ ±0.01 km s-1, that is, with approximately 1/4th of the channel width, which does not allow us to measure radial velocities with uncertainties lower than 0.01 km s-1.
-
3.
Tests with the synthesizer frequency at 2000.78125 MHz showed that the sky frequency is accurate to about 32 Hz, i.e., ≈0.0004 km s-1 at the Effelsberg 100-m telescope.
-
4.
Taking into account the revealed errors and averaging relative velocities over a sample of eight molecular cores observed in 2013, we found a null offset ⟨ΔRV⟩ = 0.003 ± 0.018 km s-1 (3σ C.L.) between the rotational and inversion transitions of the above mentioned molecules observed with the Effelsberg 100-m telescope. If this offset is interpreted in terms of Δμ/μ = (μobs − μlab)/μlab, the spatial μ-variation is constrained at the level of Δμ/μ < 2 × 10⁻⁸ (3σ C.L.), which is the strictest limit for the validity of the LPI principle based on radio astronomical observations.
-
5.
A similar null offset was found from high spectral resolution observations of the two cores L1512 and L1498 with the Medicina 32-m telescope in 2010: ⟨ΔRV⟩ = 0.000 ± 0.009 km s-1 (3σ C.L.).
Acknowledgments
We thank the staff of the Effelsberg 100-m telescope and the Medicina 32-m telescope for the assistance in observations and acknowledge the help of Giuseppe Maccaferri. SAL’s work is supported by the grant DFG Sonderforschungsbereich SFB 676 Teilprojekt C4, and in part by Research Program OFN-17 of the Division of Physics, Russian Academy of Sciences.
References
- Agafonova, I. I., Molaro, P., Levshakov, S. A., & Hou, J. L. 2011, A&A, 529, A28 [NASA ADS] [CrossRef] [EDP Sciences] [Google Scholar]
- Bagdonaite, J., Jansen, P., Henkel, C., et al. 2013, Science, 339, 46 [NASA ADS] [CrossRef] [Google Scholar]
- Bahcall, J. N., Sargent, W. L. W., & Schmidt, M. 1967, ApJ, 149, L11 [NASA ADS] [CrossRef] [Google Scholar]
- Barnard, E. E. 1927, A photographic Atlas of selected regions of the Milky Way (Carnegie Inst. Washington D.C. Publ.) [Google Scholar]
- Caselli, P., Benson, P. J., Myers, P. C., & Tafalla, M. 2002, ApJ, 572, 238 [NASA ADS] [CrossRef] [Google Scholar]
- Chand, H., Petitjean, P., Srianand, R., & Aracil, B. 2005, A&A, 430, 47 [NASA ADS] [CrossRef] [EDP Sciences] [Google Scholar]
- Clemens, D. P., & Barvainis, R. 1988, ApJS, 68, 257 [NASA ADS] [CrossRef] [Google Scholar]
- Cohen, M., & Kuhi, L. V. 1979, ApJS, 41, 743 [NASA ADS] [CrossRef] [Google Scholar]
- Dobashi, K., Uehara, H., Kandori, R., et al. 2005, PASJ, 57, 1 [Google Scholar]
- Flambaum, V. V., & Kozlov, M. G. 2007, Phys. Rev. Lett., 98, 240801 [NASA ADS] [CrossRef] [PubMed] [Google Scholar]
- Flambaum, V. V., Leinweber, D. B., Thomas, A. W., & Young, R. D. 2004, Phys. Rev. D., 69, 115006 [NASA ADS] [CrossRef] [Google Scholar]
- Fuller, G. A., & Myers, P. C. 1993, ApJ, 418, 273 [NASA ADS] [CrossRef] [Google Scholar]
- Hotzel, S., Harju, J., & Walmsley, C. M. 2004, A&A, 415, 1065 [NASA ADS] [CrossRef] [EDP Sciences] [Google Scholar]
- Klein, B., Hochgürtel, S., Krämer, I., et al. 2012, A&A, 542, L3 [NASA ADS] [CrossRef] [EDP Sciences] [Google Scholar]
- Kozlov, M. G., & Levshakov, S. A. 2013, Ann. Phys., 525, 452 [CrossRef] [Google Scholar]
- Kostelecký, V. A., Lehnert, R., & Perry, M. J. 2003, Phys. Rev. D, 68, 123511 [Google Scholar]
- Kuiper, T. B. H., Langer, W. D., & Velusamy, T. 1996, 468, 761 [Google Scholar]
- Langacker, P., Segré, G., & Strassler, M. J. 2002, Phys. Lett. B, 528, 121 [CrossRef] [Google Scholar]
- Levshakov, S. A. 1992, in High Resolution Spectroscopy with the VLT, ed. M.-H. Ulrich (ESO: Garching/Munchen), 139 [Google Scholar]
- Levshakov, S. A., Molaro, P., Lapinov, A. V., et al. 2010a, A&A, 512, A44 (Paper I) [NASA ADS] [CrossRef] [EDP Sciences] [Google Scholar]
- Levshakov, S. A., Lapinov, A. V., Henkel, C., et al. 2010b, A&A, 524, A32 (Paper II) [NASA ADS] [CrossRef] [EDP Sciences] [Google Scholar]
- Levshakov, S. A., Combes, F., Boone, F., et al. 2012, A&A, 540, L9 [NASA ADS] [CrossRef] [EDP Sciences] [Google Scholar]
- Levshakov, S. A., Henkel, C., Reimers, D., et al. 2013, A&A, 553, A58 [NASA ADS] [CrossRef] [EDP Sciences] [Google Scholar]
- Liberati, S. 2013, Class. Quant. Grav., 30, 133001 [NASA ADS] [CrossRef] [Google Scholar]
- Molaro, P., Centurión, M., Whitmore, J. B., et al. 2013, A&A, 555, A68 [NASA ADS] [CrossRef] [EDP Sciences] [Google Scholar]
- Murphy, M. T., Webb, J. K., Flambaum, V. V., Prochaska, J. X., & Wolfe, A. M. 2001, MNRAS, 327, 1237 [NASA ADS] [CrossRef] [Google Scholar]
- Olano, C. A., Walmsley, C. M., & Wilson, T. L. 1988, A&A, 196, 194 [NASA ADS] [Google Scholar]
- Pagani, L., Daniel, F., & Dubernet, M.-L. 2009, A&A, 494, 719 [NASA ADS] [CrossRef] [EDP Sciences] [Google Scholar]
- Quast, R., Reimers, D., & Levshakov, S. A. 2004, A&A, 415, L7 [NASA ADS] [CrossRef] [EDP Sciences] [Google Scholar]
- Rosenband, T., Hume, D. B., Schmidt, P. O., et al. 2008, Science, 319, 1808 [NASA ADS] [CrossRef] [PubMed] [Google Scholar]
- Savedoff, M. P. 1956, Nature, 178, 688 [NASA ADS] [CrossRef] [Google Scholar]
- Srianand, R., Chand, H., Petitjean, P., & Aracil, B. 2007, Phys. Rev. Lett., 99, 239002 [NASA ADS] [CrossRef] [Google Scholar]
- Tafalla, M., Myers, P. C., Caselli, P., & Walmsley, C. M. 2004, A&A, 416, 191 [NASA ADS] [CrossRef] [EDP Sciences] [Google Scholar]
- Tafalla, M., Santiago-García, J., Myers, P. C., et al. 2006, A&A, 455, 557 [Google Scholar]
- Truppe, S., Hendricks, R. J., Tokunaga, S. K., et al. 2013, Nat. Com., 4, 2600 [NASA ADS] [Google Scholar]
- Uzan, J.-P. 2011, Living Rev. Relativity, 14, 2 [NASA ADS] [CrossRef] [Google Scholar]
- Varshalovich, D. A., & Potekhin, A. Y. 1995, SSRv, 74, 259 [Google Scholar]
- Varshalovich, D. A., Panchuk, V. E., & Ivanchik, A. V. 1996, Astro. Lett., 22, 6 [Google Scholar]
- Webb, J. K., Flambaum, V. V., Churchill, C. W., Drinkwater, M. J., & Barrow, J. D. 1999, Phys. Rev. Lett., 82, 884 [Google Scholar]
All Tables
Radial velocities, VLSR, linewidths (FWHM), Δv, and velocity offsets, ΔRV = Vrot − Vinv, measured with the Effelsberg 100-m and the Medicina 32-m telescopes.
All Figures
|
Fig. 1 Astronomical constraints on α- and μ-variations (1σ C.L.) for the period from 1956 to 2013. Above each point, the spectral resolution (FWHM in km s-1) is indicated. α-variation constraints are based on the alkali-doublet (AD) and many-multiplet (MM) methods applied to extragalactic targets, whereas the μ-variation is based on the ammonia method (Galactic targets). The data points for the AD method are taken from Savedoff (1956), Bahcall et al. (1967), Levshakov (1992), Varshalovich & Potekhin (1995), Varshalovich et al. (1996), Murphy et al. (2001), and Chand et al. (2005); for the MM method they are taken from Webb et al. (1999), Quast et al. (2004), Srianand et al. (2007), Agafonova et al. (2011), and Molaro et al. (2013); for the ammonia method they are taken from Paper II (red circle), and the current value (red dot). The figure shows that limits on the α- and μ-variations just follow the spectral resolution approximately as Δα/α (or Δμ/μ) ∝ 1/10th of the pixel size. |
| In the text | |
|
Fig. 2 Schematic location of the observed molecular cores in projection onto the Galactic plane and equator. The Galactic center longitude is ℓ = 0°, by definition. The distance scale is given by the wedge at the top of the figure. Numbers mark sources from Table 1. |
| In the text | |
|
Fig. 3 Line-of-sight velocities (VLSR) of NH3 (J,K) = (1, 1) (squares) and HC3N J = 2–1 (triangles) along the main diagonal cuts towards the molecular cores L1512 and L1498 measured in 2010 (dashed lines) and in 2011 (solid lines) at the Effelsberg 100-m radio telescope. The half-power beam width at 23 GHz is 40′′ (50′′ at 18 GHz), the backend is the fast Fourier-transform spectrometer (FFTS) with a channel separation Δch = 0.015 km s-1 (0.020 km s-1 at 18 GHz). |
| In the text | |
|
Fig. 4 Line-of-sight velocities (VLSR) of the NH3(1, 1) transition (dots with 1σ error bars) towards the ammonia peaks in the molecular cores L1512 and L1498 measured continuously in the PSW mode at the Effelsberg 100-m radio telescope in April, 2012. The exposure time at each point is 150 s. The position-switching offsets are shown in parentheses. The backend was an extended fast Fourier-transform spectrometer (XFFTS) with a channel separation Δch = 0.039 km s-1 (marked by vertical lines). Random shifts of the VLSR values are revealed with an amplitude ≃ ±0.01 km s-1 (i.e., ≃1/4th of the channel width). |
| In the text | |
|
Fig. 5 Radial velocity differences, Δ RV, between rotational transitions of different molecules and the NH3(1, 1) inversion line for the sources observed at the Effelsberg 100-m telescope (2011–2013). 1σ statistical errors are indicated. The coordinate offsets in arcsec are given in parentheses. Filled circles are for data from this paper; open triangle, square, and circle are for data from Papers I and II. |
| In the text | |
|
Fig. 6 Spectra of NH3(1, 1) and HC3N(2–1) (yellow) towards core L1512 (offset Δα,Δδ = 0′′, 0′′) obtained at the Medicina 32-m radio telescope with the high-resolution spectrometer MSpec0 (channel widths Δch = 0.006 km s-1 and 0.008 km s-1 at 23 GHz and 18 GHz, respectively). The red curves are the best-fit model spectra. The observed linewidths are Δv(NH3) = 0.19 km s-1, and Δv(HC3N) = 0.16 km s-1. |
| In the text | |
|
Fig. 7 Same as Fig. 6, but for core L1498. The observed linewidths are Δv(NH3) = 0.19 km s-1, and Δv(HC3N) = 0.16 km s-1. |
| In the text | |
Current usage metrics show cumulative count of Article Views (full-text article views including HTML views, PDF and ePub downloads, according to the available data) and Abstracts Views on Vision4Press platform.
Data correspond to usage on the plateform after 2015. The current usage metrics is available 48-96 hours after online publication and is updated daily on week days.
Initial download of the metrics may take a while.