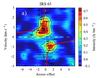
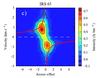
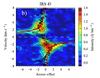
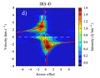
Fig. 6
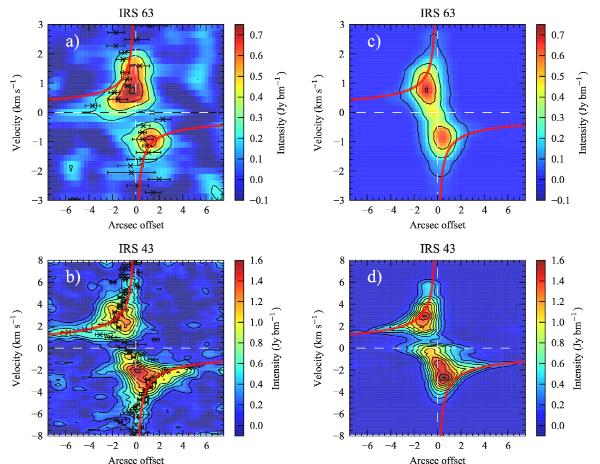
PV-diagrams of a) IRS 63 and b) IRS 43 and the corresponding best fit models c) and d). The black points and error bars in a) and b) are the channel-by-channel Gaussian fit to the (u,v)-flux. The red curves are not Keplerian rotation, but rather the best fit velocity field as given by Eq. (5). The PV-diagrams a) and b) are taken along the grey line shown in Fig. 1.
Current usage metrics show cumulative count of Article Views (full-text article views including HTML views, PDF and ePub downloads, according to the available data) and Abstracts Views on Vision4Press platform.
Data correspond to usage on the plateform after 2015. The current usage metrics is available 48-96 hours after online publication and is updated daily on week days.
Initial download of the metrics may take a while.