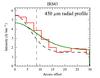
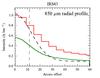
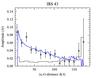
Fig. 4
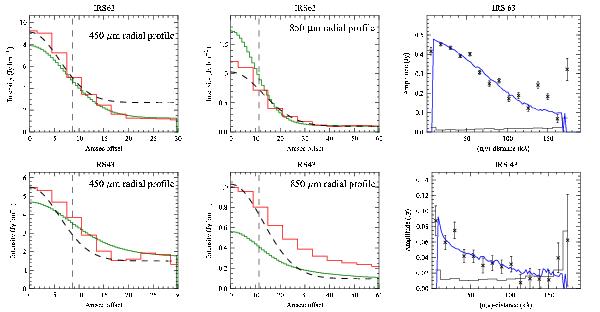
Continuum model of IRS 63 (top row) and IRS 43 (bottom row). The panels show from left to right the model fit to the radial brightness distribution of the SCUBA images and the model fit to the 1.1 mm SMA averaged visibility amplitudes. In the SCUBA profile plots, the data are shown with a red histogram and the model with a green histogram. The black dashed curve is a 2D Gaussian fit to the data. The vertical dashed line indicates the beam size. The visibility amplitudes of IRS 63 are the same as are shown in Fig. 2 but binned in much wider bins. In the visibility plots, the Fourier transform of the model is shown in blue.
Current usage metrics show cumulative count of Article Views (full-text article views including HTML views, PDF and ePub downloads, according to the available data) and Abstracts Views on Vision4Press platform.
Data correspond to usage on the plateform after 2015. The current usage metrics is available 48-96 hours after online publication and is updated daily on week days.
Initial download of the metrics may take a while.