Free Access
Fig. 1

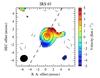
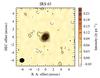
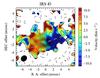
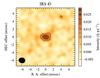
Moment 0 (contour) and 1 (color) maps of the HCO+J = 3 − 2 line (left) and 1.1 mm continuum image (right) of IRS 63 and IRS 43. The beam is shown by the black ellipses. The dashed grey line marks the direction of the velocity gradient.
This figure is made of several images, please see below:
Current usage metrics show cumulative count of Article Views (full-text article views including HTML views, PDF and ePub downloads, according to the available data) and Abstracts Views on Vision4Press platform.
Data correspond to usage on the plateform after 2015. The current usage metrics is available 48-96 hours after online publication and is updated daily on week days.
Initial download of the metrics may take a while.