Free Access
Fig. 4
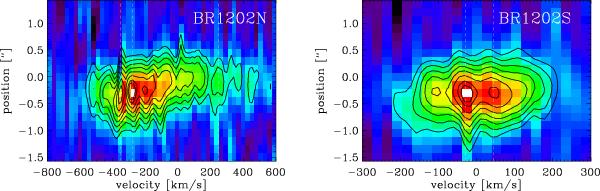
Left panel: the position-velocity diagram extracted from a three-pixel-wide E-W slit centered on the N source (SMG). The right panel is the PV diagram for a slit oriented N-S and centered on the S source (QSO). The white dashed lines identify the components discussed in the text.
This figure is made of several images, please see below:

Current usage metrics show cumulative count of Article Views (full-text article views including HTML views, PDF and ePub downloads, according to the available data) and Abstracts Views on Vision4Press platform.
Data correspond to usage on the plateform after 2015. The current usage metrics is available 48-96 hours after online publication and is updated daily on week days.
Initial download of the metrics may take a while.