Fig. 13
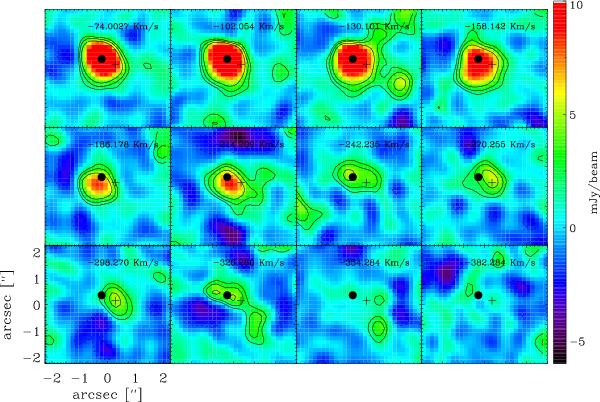
Brightness per velocity channel in the QSO. Color-coded values and contours at [2, 3, 5] σ levels are shown. The numbers in the upper right corners of the panels denote the central velocity of the channel. The filled circle represents the peak of the integrated surface brightness of the quasar, while the cross represents the peak of the surface brightness of the faint companion, which is detected in channels ~ − 362: − 242 km s-1.
Current usage metrics show cumulative count of Article Views (full-text article views including HTML views, PDF and ePub downloads, according to the available data) and Abstracts Views on Vision4Press platform.
Data correspond to usage on the plateform after 2015. The current usage metrics is available 48-96 hours after online publication and is updated daily on week days.
Initial download of the metrics may take a while.