Fig. 12
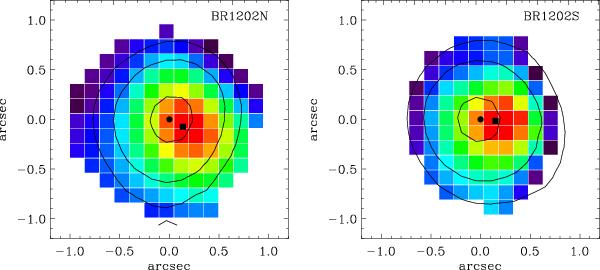
Surface brightness maps of the sources identified as faint components in the spectral fits: the left and right panels show the SMG and QSO, respectively. The black contours denote the surface brightnesses of the main spectral components; the filled circles and squares denote the centroids of the main and faint components, respectively.
Current usage metrics show cumulative count of Article Views (full-text article views including HTML views, PDF and ePub downloads, according to the available data) and Abstracts Views on Vision4Press platform.
Data correspond to usage on the plateform after 2015. The current usage metrics is available 48-96 hours after online publication and is updated daily on week days.
Initial download of the metrics may take a while.