Fig. 1
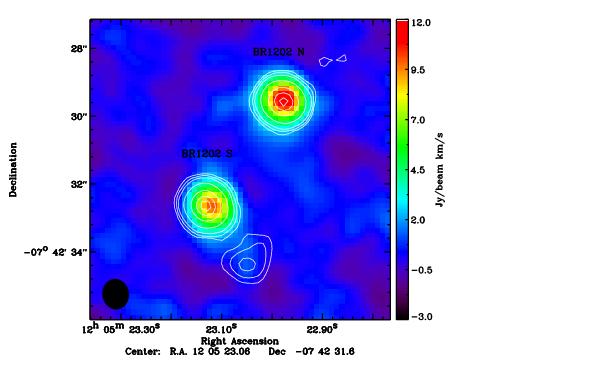
[CII] integrated intensity map in BR 1202-0725 with identification of the north and south sources. The rms noise is 0.6 Jy km s-1. The synthesized beam (0.8′′ × 0.7′′) is indicated by a filled black ellipse in the lower left corner of the plot. The continuum emission of BR 1202-0725 a 334 GHz is overplotted as white contours. The contour levels are logarithmic [–3.4, –3.2, –3.0, –2.6, 2.2, 2.0, 1.9] of σ with σ = 0.2 mJy. The rms noise is 0.2 mJy beam-1.
Current usage metrics show cumulative count of Article Views (full-text article views including HTML views, PDF and ePub downloads, according to the available data) and Abstracts Views on Vision4Press platform.
Data correspond to usage on the plateform after 2015. The current usage metrics is available 48-96 hours after online publication and is updated daily on week days.
Initial download of the metrics may take a while.