Fig. B.1
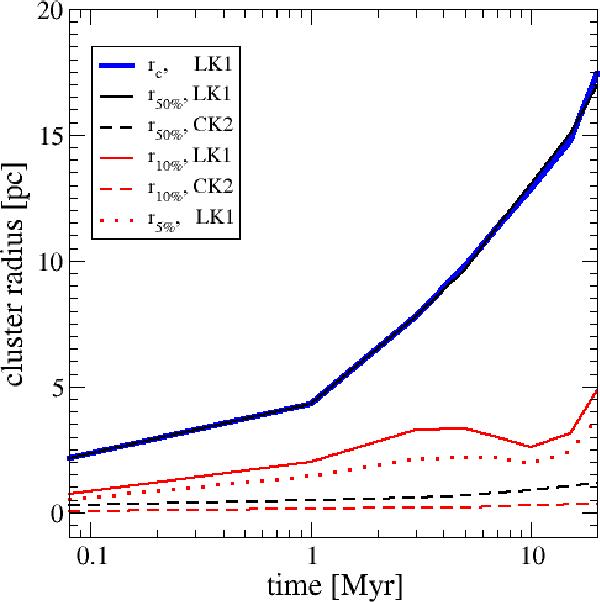
Development of the radius of the bound cluster mass over time for the case of 30% and 70% SFE. The solid lines give the results for clusters with  pc and 70% SFE (model CK 1) representative for compact clusters, and the dashed lines indicate clusters with
  pc (model LK 1) and 30% SFE depicting loose clusters. The black lines indicate the half-mass radii and the red lines the 10% Lagrange radii. The red dotted line indicates the 5% Lagrange radius for the loose clusters. For the compact clusters the 5% Lagrange radius would be basically indistinguishable from the 10% Lagrange line in the representation chosen here.
Current usage metrics show cumulative count of Article Views (full-text article views including HTML views, PDF and ePub downloads, according to the available data) and Abstracts Views on Vision4Press platform.
Data correspond to usage on the plateform after 2015. The current usage metrics is available 48-96 hours after online publication and is updated daily on week days.
Initial download of the metrics may take a while.