Free Access
Fig. A.1
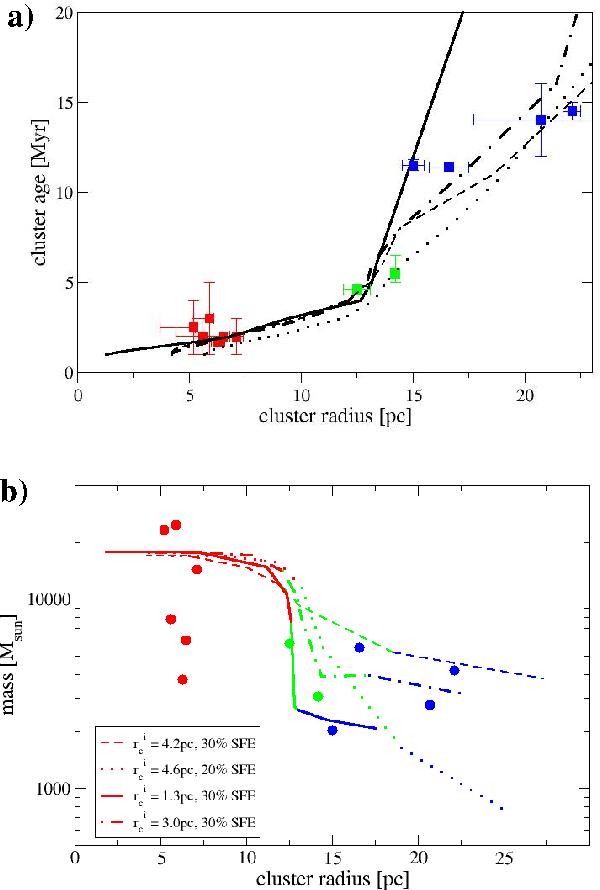
Same as Fig. 3, but here for model LK1 only the simulation results for 30% SFE are shown (solid line). Those are compared to the results obtained using a larger initial radius (models LK 2 and LK 5 – dash-dotted line). For model LK 2 the cases of 20% (dotted line) and 30% (dashed line) SFE are depicted.
Current usage metrics show cumulative count of Article Views (full-text article views including HTML views, PDF and ePub downloads, according to the available data) and Abstracts Views on Vision4Press platform.
Data correspond to usage on the plateform after 2015. The current usage metrics is available 48-96 hours after online publication and is updated daily on week days.
Initial download of the metrics may take a while.