Fig. 3
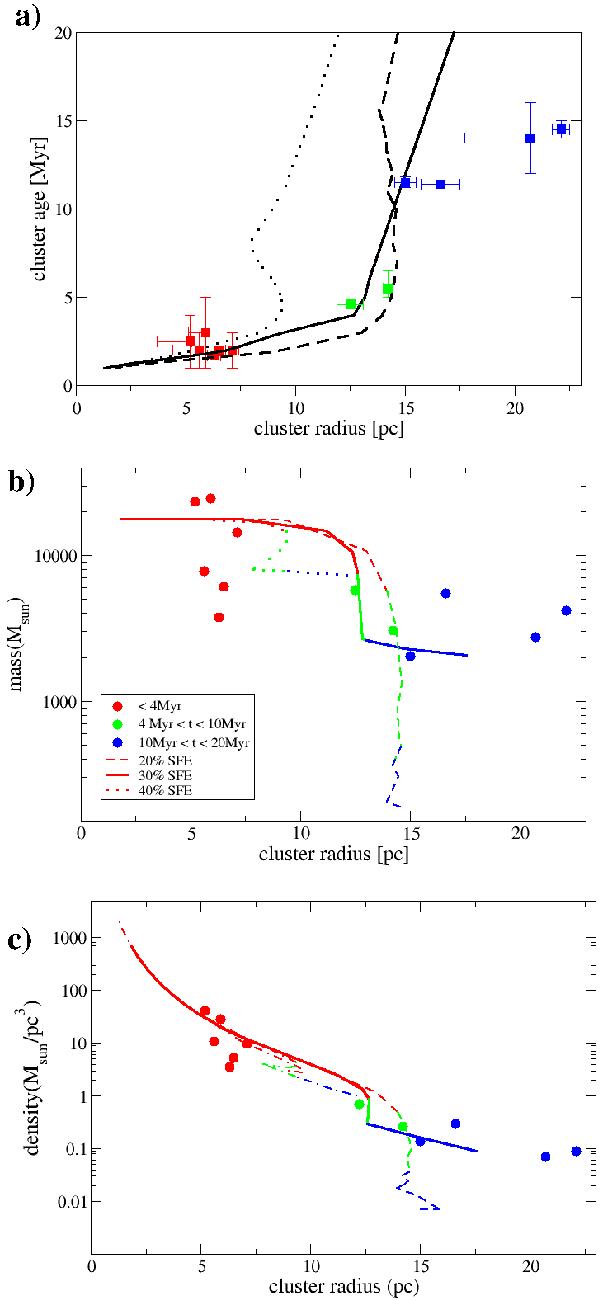
Comparison between the simulations results for 20% (dashed), 30% (solid), and 40% (dotted) SFE for model LK 1 and the observed properties of young massive loose clusters (circles) as summarised in Pfalzner (2009). a) shows the relation between cluster age and size rc; b) the cluster mass; and c) the cluster density as function of cluster size, respectively. The colours indicate cluster age (red tc < 4 Myr, green 4 Myr < tc < 10 Myr, blue tc > 10 Myr), where in the simulations it was assumed that the cluster had an age of 1 Myr at the time of instantaneous gas expulsion.
Current usage metrics show cumulative count of Article Views (full-text article views including HTML views, PDF and ePub downloads, according to the available data) and Abstracts Views on Vision4Press platform.
Data correspond to usage on the plateform after 2015. The current usage metrics is available 48-96 hours after online publication and is updated daily on week days.
Initial download of the metrics may take a while.