Fig. 7
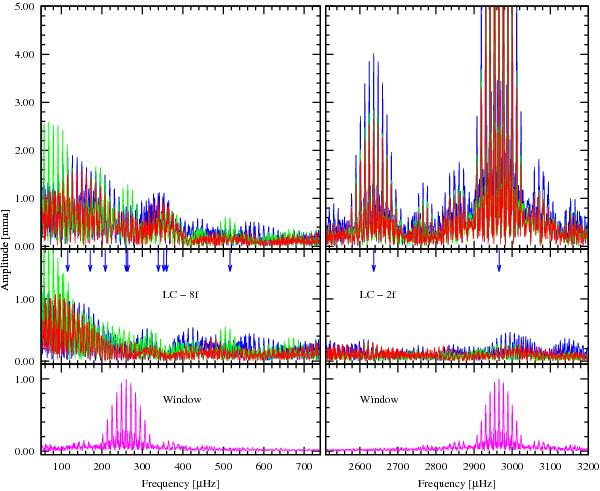
Amplitude spectrum of the orbit-subtracted Ultracam light curve (LC), for the two frequency regions where pulsations are observed. Upper panel: the amplitude spectra of the three photometric channels (red: r-band, green: g-band, blue: u-band). Middle panel: the same spectra after prewhitening the 10 frequencies listed in Table 6 from the LC. Lower panel: window function for the two frequency regions.
Current usage metrics show cumulative count of Article Views (full-text article views including HTML views, PDF and ePub downloads, according to the available data) and Abstracts Views on Vision4Press platform.
Data correspond to usage on the plateform after 2015. The current usage metrics is available 48-96 hours after online publication and is updated daily on week days.
Initial download of the metrics may take a while.