Fig. 4
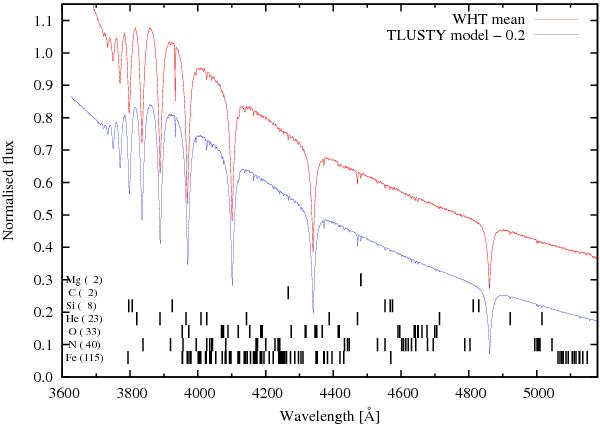
Sum of the 17 WHT spectra from 2010 after correcting for the orbital velocity. The S/N in this mean spectrum peaks at ~350, and many weak metal lines can be distinguished in addition to the Balmer lines and He i lines at 4472 and 4026 Å. The slope of the observed spectrum was corrected by dividing with an instrument response function derived from a flux standard to put it on a Fλ grid. The absolute units are arbitrary. Shifted down by 0.2 is the model fit computed with Tlusty/XTgrid. The final parameters for this model fit are given in Table 5.
Current usage metrics show cumulative count of Article Views (full-text article views including HTML views, PDF and ePub downloads, according to the available data) and Abstracts Views on Vision4Press platform.
Data correspond to usage on the plateform after 2015. The current usage metrics is available 48-96 hours after online publication and is updated daily on week days.
Initial download of the metrics may take a while.