Fig. 4
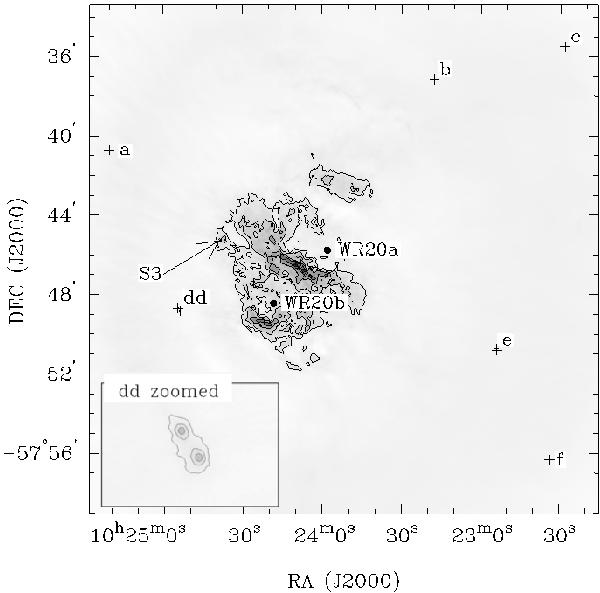
ATCA 5.5 GHz image of RCW 49 and surroundings. The contour levels are –0.6, 3, 9, 20, 35, and 60 mJy beam-1; the synthesized beam is 3′′ × 3′′. Crosses mark the positions of radio sources detected near RCW 49; these are cataloged in Table 2. The arrow shows the position of a bow-shaped structure, S3 (see Sect. 3.4). The WR stars 20a and 20b are marked with solid circles. The inset shows the emission of source “dd”, with contour levels of 2, 4, and 8 mJy beam-1.
Current usage metrics show cumulative count of Article Views (full-text article views including HTML views, PDF and ePub downloads, according to the available data) and Abstracts Views on Vision4Press platform.
Data correspond to usage on the plateform after 2015. The current usage metrics is available 48-96 hours after online publication and is updated daily on week days.
Initial download of the metrics may take a while.