Free Access
Fig. 7
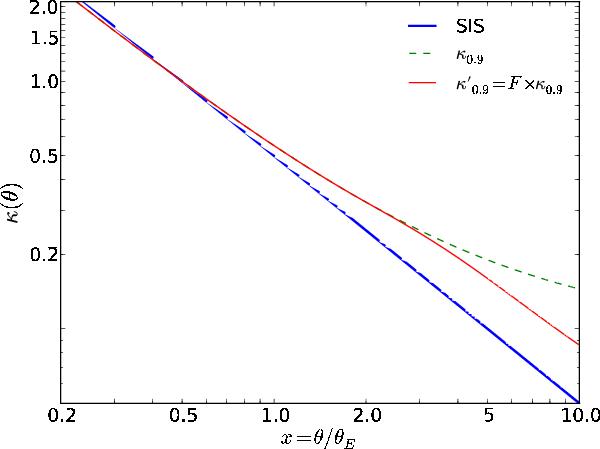
The solid blue curve shows the isothermal density profile, the dashed curve shows the mass-sheet transformed profile κλ with λ = 0.9, and the thin solid red curve shows κ0., modified by multiplication with a smooth function F as described in the text.
Current usage metrics show cumulative count of Article Views (full-text article views including HTML views, PDF and ePub downloads, according to the available data) and Abstracts Views on Vision4Press platform.
Data correspond to usage on the plateform after 2015. The current usage metrics is available 48-96 hours after online publication and is updated daily on week days.
Initial download of the metrics may take a while.