Fig. 6
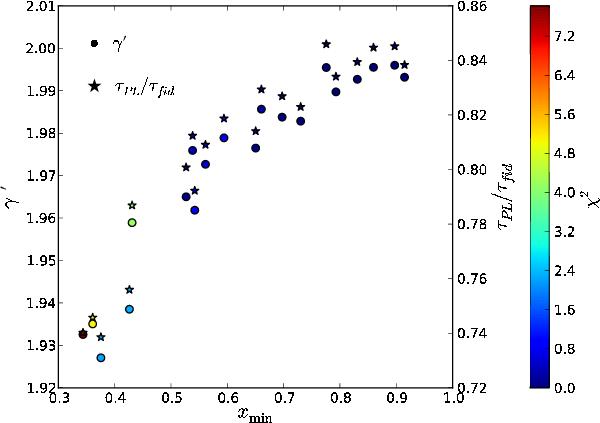
Result of the fit of the (singular) power-law model to the composite model for 20 different sets of complex sources. For each realization of the complex source, we show the value of the logarithmic slope γ′ (circles) of the fitted power law as a function of the position of the inner-most lensed image in the system (xmin). The time-delay ratio is also shown (star-like symbols). The color code shows the (non-reduced) χ2 obtained for the fit of the power-law model; the typical number of degrees of freedom is ~30.
Current usage metrics show cumulative count of Article Views (full-text article views including HTML views, PDF and ePub downloads, according to the available data) and Abstracts Views on Vision4Press platform.
Data correspond to usage on the plateform after 2015. The current usage metrics is available 48-96 hours after online publication and is updated daily on week days.
Initial download of the metrics may take a while.