Fig. 3
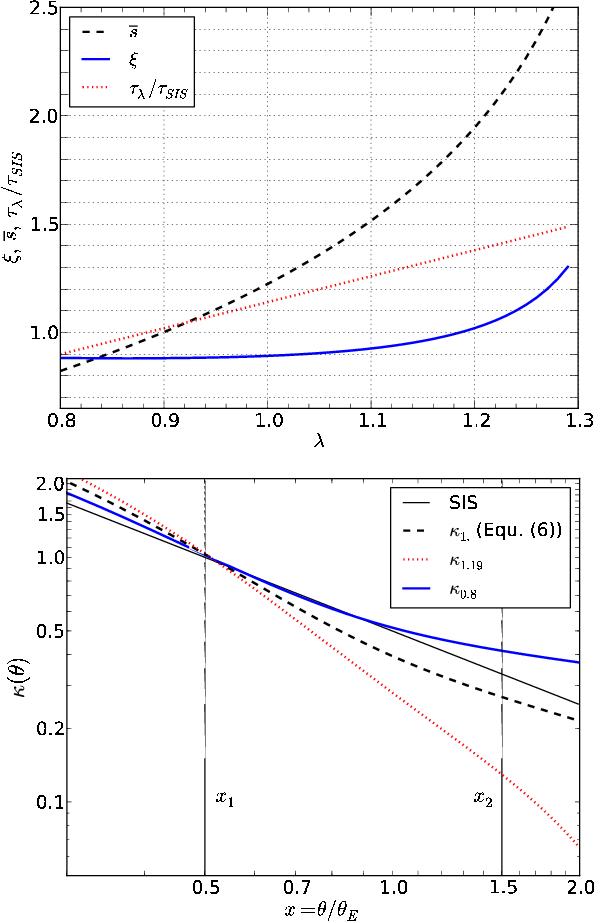
Upper panel: the quantity ξ (blue solid curve), the mean slope  (dashed black curve) and the ratio of the time delays τ = H0 Δt (dotted red curve) for the mass models κλ and that of the singular isothermal sphere, as a function of λ. Lower panel: the mass profiles of the model described by (6) (dashed black curve), two mass-sheet transformed ones (κ0.8 – solid blue curve, and κ1.19 – dotted red curve), and that of the corresponding SIS (thin black curve).
Current usage metrics show cumulative count of Article Views (full-text article views including HTML views, PDF and ePub downloads, according to the available data) and Abstracts Views on Vision4Press platform.
Data correspond to usage on the plateform after 2015. The current usage metrics is available 48-96 hours after online publication and is updated daily on week days.
Initial download of the metrics may take a while.