Fig. 2
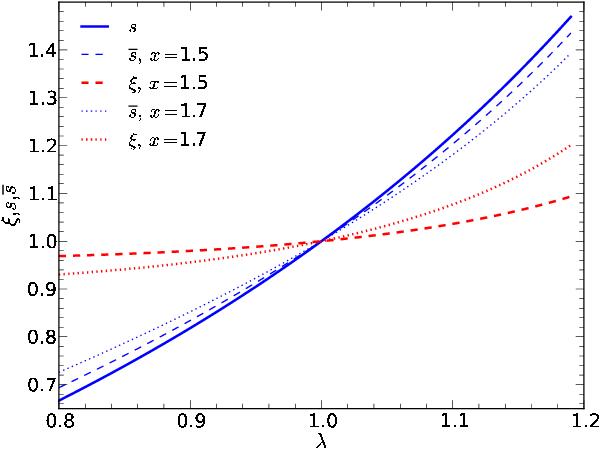
For the mass models obtained by the transformation (1) of an SIS model, we plot the local slope s = λ/(2 − λ) at the Einstein radius as thick blue solid curve. The dashed and dotted thin blue curves show the mean slope  over the interval (2 − x)θE ≤ θ ≤ xθE, for x = 1.5 and x = 1.7, respectively. For the same parameters, the dotted and dashed red thick curves show the quantity ξ which provides a measure of the deviation of κλ from a power law, over the same angular range.
Current usage metrics show cumulative count of Article Views (full-text article views including HTML views, PDF and ePub downloads, according to the available data) and Abstracts Views on Vision4Press platform.
Data correspond to usage on the plateform after 2015. The current usage metrics is available 48-96 hours after online publication and is updated daily on week days.
Initial download of the metrics may take a while.