Free Access
Fig. 1
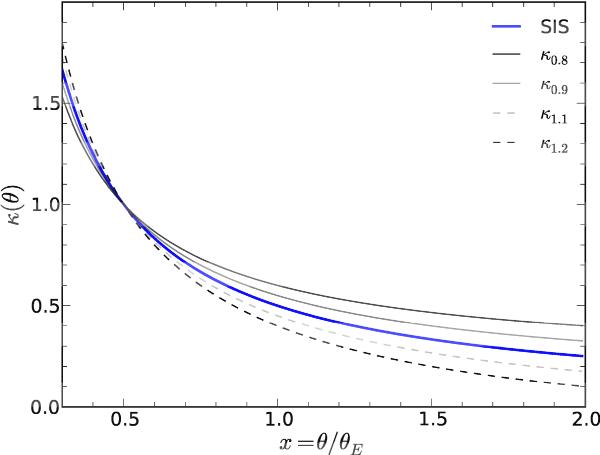
The isothermal density profile (thick curve), and several of the transformed profiles κλ(θ), with λ ranging from 0.8 (flattest curve) to 1.2 (steepest curve), plotted as a function of x = θ/θE. Note that, if the SIS density profile provides a good fit to the lensing data, an equally good fit is obtained by all the κλ.
Current usage metrics show cumulative count of Article Views (full-text article views including HTML views, PDF and ePub downloads, according to the available data) and Abstracts Views on Vision4Press platform.
Data correspond to usage on the plateform after 2015. The current usage metrics is available 48-96 hours after online publication and is updated daily on week days.
Initial download of the metrics may take a while.