Free Access
Fig. 9
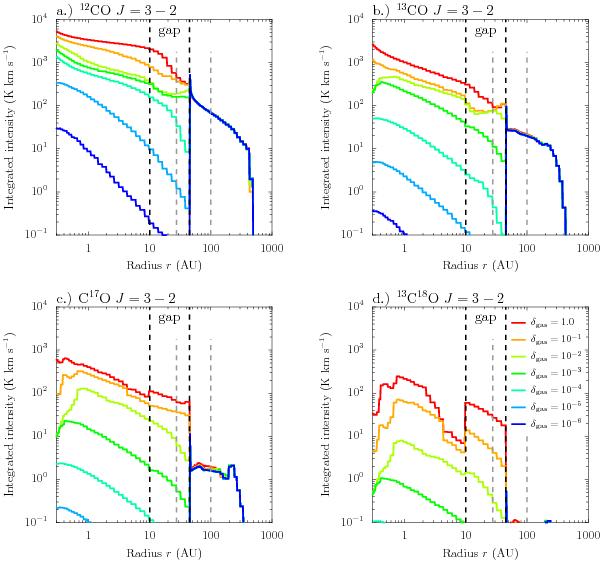
Continuum subtracted integrated line intensity as function of the radius for CO 3 − 2 and its isotopologues. The figure shows intensities derived from the representative models (Table 1). The vertical gray lines at 28 AU and 100 AU indicate the radii and which the intensities are provided in Figs. 12 and 15.
Current usage metrics show cumulative count of Article Views (full-text article views including HTML views, PDF and ePub downloads, according to the available data) and Abstracts Views on Vision4Press platform.
Data correspond to usage on the plateform after 2015. The current usage metrics is available 48-96 hours after online publication and is updated daily on week days.
Initial download of the metrics may take a while.