Fig. 4
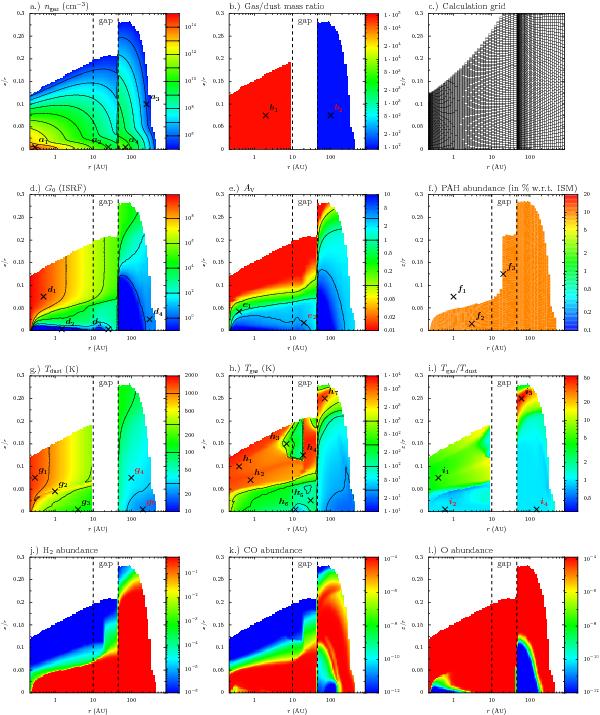
Physical conditions in a representative model (Table 1) with δgas = 10-2 and δdust = 10-5 (dusty inner disk present). Only regions with a gas density larger than 105 cm-3 are shown. The contour lines on the panels match to the lines on the color bars. The panels provide a) gas density structure; b) gas/dust mass ratio; c) calculation grid; d) FUV radiation field; e) visual extinction; f) abundance of PAHs; g) dust temperature; h) gas temperature; i) ratio of gas to dust temperature; j) H2 abundance; k) CO abundance; and l) O abundance.
Current usage metrics show cumulative count of Article Views (full-text article views including HTML views, PDF and ePub downloads, according to the available data) and Abstracts Views on Vision4Press platform.
Data correspond to usage on the plateform after 2015. The current usage metrics is available 48-96 hours after online publication and is updated daily on week days.
Initial download of the metrics may take a while.