Fig. 15
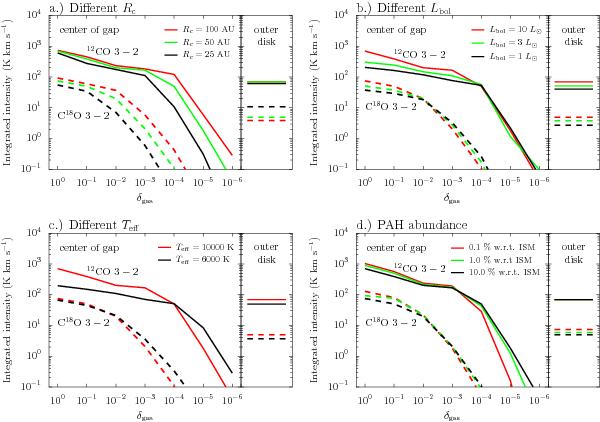
Integrated intensities of 12CO 3 − 2 (solid lines) and C18O 3 − 2 (dashed lines) at the center of the gap (r = 28 AU) and in the outer disk (r = 100 AU). The panels show the intensities for variations of one parameter (Rc, Lbol, Teff and the PAH abundance). If not varied, the parameters are set to the values of the representative models (Table 1: Rc = 50 AU, Lbol = 10 L⊙, Teff = 10 000 K and a PAH abundance of 10% the ISM abundance).
Current usage metrics show cumulative count of Article Views (full-text article views including HTML views, PDF and ePub downloads, according to the available data) and Abstracts Views on Vision4Press platform.
Data correspond to usage on the plateform after 2015. The current usage metrics is available 48-96 hours after online publication and is updated daily on week days.
Initial download of the metrics may take a while.