Fig. 10
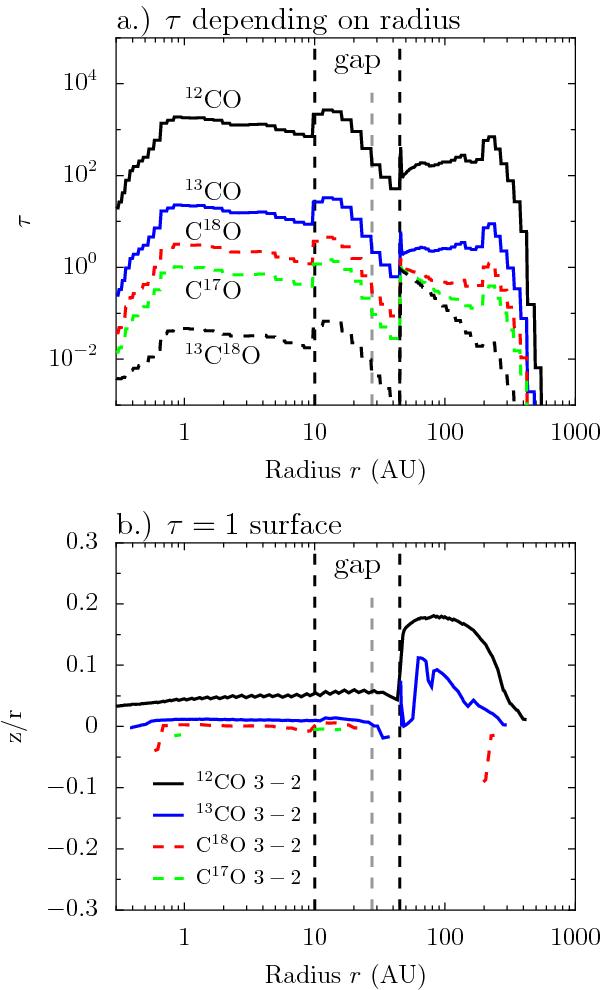
Surface of τ = 1 and line opacities of CO 3 − 2 and isotopologues for the representative model (Table 1) with δgas = 10-2 and a dusty inner disk present (δdust = 10-5). The vertical gray line at 28 AU shows the center of the gap. Upper panel: line center opacity depending on the radius. Lower panel: position of the τ = 1 surface for different radii.
Current usage metrics show cumulative count of Article Views (full-text article views including HTML views, PDF and ePub downloads, according to the available data) and Abstracts Views on Vision4Press platform.
Data correspond to usage on the plateform after 2015. The current usage metrics is available 48-96 hours after online publication and is updated daily on week days.
Initial download of the metrics may take a while.