| Issue |
A&A
Volume 559, November 2013
|
|
|---|---|---|
| Article Number | A6 | |
| Number of page(s) | 18 | |
| Section | Stellar structure and evolution | |
| DOI | https://doi.org/10.1051/0004-6361/201220792 | |
| Published online | 28 October 2013 | |
Symbiotic stars in X-rays⋆
1 Instituto de Astronomía y Física del Espacio (IAFE), CC 67 – Suc. 28, C1428ZAA Caba, Argentina
e-mail: This email address is being protected from spambots. You need JavaScript enabled to view it.
2 Columbia Astrophysics Lab, 550 W120th St., 1027 Pupin Hall, MC 5247 Columbia University, 10027 New York, USA
3 CRESST and X-ray Astrophysics Laboratory, NASA/GSFC, Greenbelt, MD 20771, USA
4 Department of Physics, University of Maryland, Baltimore County, 1000 Hilltop Circle, Baltimore, MD 21250, USA
5 School of Physics and Astronomy, University of Minnesota, 116 Church St SE, Minneapolis, MN 55409, USA
Received: 26 November 2012
Accepted: 30 July 2013
Abstract
Until recently, symbiotic binary systems in which a white dwarf accretes from a red giant were thought to be mainly a soft X-ray population. Here we describe the detection with the X-ray Telescope (XRT) on the Swift satellite of nine white dwarf symbiotics that were not previously known to be X-ray sources and one that had previously been detected as a supersoft X-ray source. The nine new X-ray detections were the result of a survey of 41 symbiotic stars, and they increase the number of symbiotic stars known to be X-ray sources by approximately 30%. The Swift/XRT telescope detected all of the new X-ray sources at energies greater than 2 keV. Their X-ray spectra are consistent with thermal emission and fall naturally into three distinct groups. The first group contains those sources with a single, highly absorbed hard component that we identify as probably coming from an accretion-disk boundary layer. The second group is composed of those sources with a single, soft X-ray spectral component that probably originates in a region where low-velocity shocks produce X-ray emission, i.e., a colliding-wind region. The third group consists of those sources with both hard and soft X-ray spectral components. We also find that unlike in the optical, where rapid, stochastic brightness variations from the accretion disk typically are not seen, detectable UV flickering is a common property of symbiotic stars. Supporting our physical interpretation of the two X-ray spectral components, simultaneous Swift UV photometry shows that symbiotic stars with harder X-ray emission tend to have stronger UV flickering, which is usually associated with accretion through a disk. To place these new observations in the context of previous work on X-ray emission from symbiotic stars, we modified and extended the α/β/γ classification scheme for symbiotic-star X-ray spectra that was introduced by Muerset et al. based upon observations with the ROSAT satellite, to include a new δ classification for sources with hard X-ray emission from the innermost accretion region. Because we have identified the elusive accretion component in the emission from a sample of symbiotic stars, our results have implications for the understanding of wind-fed mass transfer in wide binaries, and the accretion rate in one class of candidate progenitors of type Ia supernovae.
Key words: binaries: symbiotic / accretion, accretion disks / X-rays: binaries
Tables 1 and 3 are available in electronic form at http://www.aanda.org
© ESO, 2013
1. Introduction
Symbiotic stars are wide binary systems in which a compact object, usually a white dwarf, accretes from a more evolved companion, a red giant. Given that symbiotic stars are very heterogeneous objects, a precise observational definition naturally yields outliers (see Santander-García et al. 2009, and references therein). Historically, a symbiotic system has been identified as such if its optical spectrum shows features of TiO from the red giant photosphere, emission lines of, for example, H I, He II, [OIII], and sometimes a faint blue continuum. However, there are sources where some of these characteristics are not detected, either owing to the high degree of variability of symbiotics or to different system parameters such as ionizing source and nebular density. Examples of these outliers are V704 Cen where high ionization emission lines from He II or Fe VII are not detected (Cieslinski et al. 1994); IC 10 without emission lines from He (Gonçalves et al. 2008), and IGR J17197-3010 (re-identified in this work as SWIFT J171951.7-300206, see Sect. 4) where only H lines and a red giant continuum are reported (Masetti et al. 2012).
We therefore propose a physical definition where a symbiotic system is a binary in which a red giant transfers enough material to a compact companion to produce an observable signal at any wavelength. The interaction between a red giant and its compact companion can manifest itself in different ways depending upon the system parameters. Thus, our proposed definition of this class of interacting binaries is as free as possible of observational selection biases. Recognizing that a red giant can transfer material onto different types of compact companions, we refer to those that we believe have white dwarf (WD) companions as WD symbiotics and those with neutron-star (or even black-hole) companions as symbiotic X-ray binaries (Masetti et al. 2006). In this paper, we primarily consider WD symbiotics. Because of the strong wind from the red giant, the binary system is surrounded by a dense nebula that is ionized by the UV radiation from the WD photosphere and/or the accretion disk. The orbital periods of symbiotic stars range from a few hundred to a few thousand days (Belczyński et al. 2000). Although in WD symbiotics the white dwarfs often have masses of approximately 0.6 M⊙(Mikołajewska 2007), more massive white dwarfs, including those with masses close to the Chandrasekhar mass (MCh) limit, are known to exist in WD symbiotics that experience recurrent nova outbursts or produce strong, hard X-ray emission (e.g., RS Oph, RT Cru; Sokoloski et al. 2006b; Luna & Sokoloski 2007).
The search for the progenitors of type Ia supernovae (SNIa) is currently a very active area of research. White dwarf symbiotics have been proposed as the progenitors of some SNIa either through the single or double degenerate channels. If the white dwarf in WD symbiotics can accrete at a rate that is high enough for its mass to approach MCh, it could become a SNIa via the single-degenerate channel (e.g., Munari & Renzini 1992; Wang & Han 2010). Di Stefano (2010) proposed that some WD symbiotics might appear as the so-called pre-double degenerate systems, before the two WDs with a total mass of greater than MCh come close enough to merge within a Hubble time. There is observational evidence that at least some SNIa have a symbiotic system as a progenitor (Patat et al. 2007; Chiotellis et al. 2012; Dilday et al. 2012). To investigate the likelihood of WD symbiotics producing a significant fraction of SNIa, it is crucial to collect the information needed to derive basic parameters such as MWD and Ṁ.
Unlike cataclysmic variables (CV), where accretion is driven by Roche-lobe overflow, the accretion mechanism in symbiotics is believed to be mainly some form of wind accretion (Bondi-Hoyle; Bondi & Hoyle 1944). Nevertheless, a consideration of angular momentum of the wind captured by the Bondi-Hoyle process leads to the conclusion that the formation of an accretion disk is common (Livio & Warner 1984; Wynn 2008; Alexander et al. 2011). X-ray images of the WD symbiotic o Ceti show a stream of material flowing from the red giant toward the WD (Karovska et al. 2005), which can be understood in the context of what is known as the wind Roche-lobe overflow scenario proposed by Podsiadlowski & Mohamed (2007). This model suggests that even if the red giant does not fill its Roche lobe, its wind can and it is therefore focused toward the L1 point of the orbit, further increasing the likelihood of the formation of an accretion disk around the white dwarf. Sokoloski & Bildsten (2010), however, found no evidence that this mechanism is enhancing the accretion rate onto the white dwarf in this binary relative to the rate expected from pure Bondi-Hoyle wind-accretion.
If an accretion disk is present, the innermost region of the accretion disk, i.e., the boundary layer, can produce X-rays. As in dwarf novae, the boundary layer in the accretion disk of WD symbiotics can be a strong source of hard (E ≳ 2 keV) X-rays at accretion rates for which it is expected to be optically thin (e.g., Ṁ ≤ 10-9.5M⊙ yr-1 for a 1 M⊙ WD; Narayan & Popham 1993). The temperature of the optically thin component, and hence the hardness of the X-ray spectrum, is expected to be a function of the gravitational potential well (see Fig. 2 in Byckling et al. 2010); the more massive the white dwarf, the harder the spectrum. The combination of the mass of the accreting object and accretion rate determines what the spectrum will look like in X-rays (Kylafis & Lamb 1982). White dwarfs accreting at a high rate can display a softer spectrum due probably to Compton cooling, while a harder spectrum will be detected from an equally massive white dwarf that is accreting at a lower rate. The different hardness of the X-ray spectra from RS Oph (Nelson et al. 2011) and T CrB (Luna et al. 2008), two recurrent novae with similar white dwarfs masses, could be explained by their different accretion rates.
If the white dwarf magnetic field is strong, greater than a few times 105−6 G at the surface of the WD, hard X-rays are expected to arise from the magnetically channeled accretion flow onto a portion of the white dwarf surface. The observational signature of this type of accretion is the modulation of the light at the white dwarf spin period. In polars and intermediate polars (magnetic, accreting white dwarfs with low mass main sequence companions), the modulation is detected from optical to X-rays wavelengths (Warner 1995). In WD symbiotics, only one system has been detected with a coherent modulation, as due to magnetic accretion, of optical emission with a period of approximately 28 m (Z And; Sokoloski et al. 2006a) while an oscillation with a period of 1734 s was marginally detected (95% confidence) in X-rays from R Aqr(Nichols et al. 2007).
Soft (E ≲ 2 keV), optically thin, X-ray emission in WD symbiotics can also occur in several different circumstances. For example, soft X-rays could be produced if the system contains shocks with lower velocities than those of the shocks in a boundary layer or accretion column, as might be expected in a region where the winds from the white dwarf (e.g., Kenny & Taylor 2005) or the accretion disk and red giant collide. A hot accretion disk corona, as proposed in dwarf novae (e.g. Ishida et al. 2009), or the red giant wind photoionized by hard X-rays would also be detected at soft X-ray energies. Although a ROSAT-based classification scheme for the X-ray spectra of symbiotic stars (Muerset et al. 1997) provided a useful framework for early work on X-ray emission from these objects, the fact that a number of symbiotics are now known to produce X-rays with energies of greater than 20 keV (e.g., Kennea et al. 2009; Corbet et al. 2008; Baumgartner et al. 2013) indicates that a new treatment of X-rays from symbiotic stars is needed. Using pointed ROSAT observations, Muerset et al. (1997) detected 16 symbiotic stars and suggested a classification scheme based on the hardness of the spectra. They called α-type those systems where emission with energies of less than ≲0.4 keV originates in quasi-steady thermonuclear burning on the surface of the accreting white dwarf, and β-type those with X-ray spectra that peak at energies of about 0.8 keV that might originate in a region where the winds from the two stars collide. Because of the small bandpass of ROSAT, the X-ray spectra of sources with harder emission than the β-types were only poorly characterized; they were named γ-types. This scenario changed dramatically with the discovery of very hard X-ray emission (E > 50 keV) from the symbiotic star RT Cru with INTEGRAL (Chernyakova et al. 2005) and Swift (Tueller et al. 2005) in 2005. Since then, three more systems were observed to have X-ray emission with energies higher than ≈10 keV (T CrB, V648 Car, CH Cyg; Smith et al. 2008; Kennea et al. 2009; Mukai et al. 2007). The observed spectra are all compatible with highly absorbed (nH ≈ 1022 − 23 cm-2) optically thin thermal emission with plasma temperatures corresponding to kT ≈ 5 − 50 keV. Given that modulation has not been detected in their light curves, the hard X-ray emission most likely originates in the accretion disk boundary layer. The X-ray spectral fitting indicated that, like the WD symbiotics that produce softer X-rays, these hard X-ray producing symbiotics contain white-dwarf accretors. The high, variable absorption, which might be related with a clumpy medium moving into our line of sight (Kennea et al. 2009), may explain why these systems were not detected in all sky surveys such as ROSAT All Sky Survey. In the neutron-star accretors (i.e., symbiotic X-ray binaries), the broad-band X-ray spectra are usually due to optically thick Comptonizing plasma with no emission lines (see, e.g., Marcu et al. 2011, and references therein).
In this article, we present the results of a Swift fill-in program whose aim was to search for hard X-ray emission from WD symbiotic, and a target of opportunity (ToO) program to identify the X-ray counterpart of IGR J17197-3010. We describe Swift observations of nine newly discovered hard X-ray emitting WD symbiotics and one previously known supersoft source. With these new, broad-band X-ray data, it becomes necessary to introduce a classification scheme that is a modification and extension of the one proposed by Muerset et al. (1997). Observations and data analysis details are presented in Sect. 2 while results are shown in Sects. 3 and 4. Section 5 presents the discussion and concluding remarks.
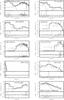 |
Fig. 1 Swift/XRT spectra of the WD symbiotics with newly discovered X-ray emission together with their X-ray spectral types: NQ Gem, UV Aur, ZZ CMi, ER Del, Hen 3-461, CD-28 3719, StHα 32, BI Cru, V347 Nor, and SWIFT J171951.7-300206. The full line shows the best-fit model described in Sect. 3, while the dotted line shows the contribution of the individual spectral components in the case of multi-component models. The X-ray spectral classification for each source is included between parentheses in each panel and is listed in Table 4. |
2. Observations and data reduction
During cycle 6, Swift observed 41 symbiotics using the X-ray Telescope (XRT) and the Ultraviolet/Optical Telescope (UVOT). We obtained these observations as part of a Swift Fill-in (6090813, PI: J. Sokoloski) and a ToO program (Target ID 31648, PI: G. J. M. Luna). Except for SWIFT J171951.7-300206, which we found serendipitously in the field of IGR J17197-3010(Luna et al. 2012), we selected our targets from the symbiotic-star catalog of Belczyński et al. (2000), which lists 188 confirmed and 30 suspected symbiotics. After excluding objects with previous X-ray detections (except for StHα 32, which we retained by accident), we chose the sources that are the most likely to be nearby and therefore the most likely to be detectable with Swift. Most of the objects in the Belczyński et al. catalog do not have distance estimates available in the literature, so we used source brightness in the V and K bands (which are dominated by light from the red giant) as a proxy for proximity, including all objects with either V brighter than 10.9 mag (but fainter than the UVOT optical brightness limit) or K brighter than 5.0 mag. Since symbiotic stars are a disk population, objects with very large galactic latitude |b| are also preferentially nearby. Our target list thus also included all objects with |b| > 11°. Swift observed all objects for approximately 10 ks (in most cases using multiple visits) in photon counting mode (PC) of the XRT. The UVOT observations used either the U (λ3465 Å, FWHM = 785 Å), UVW1 (λ2600 Å, FWHM = 693 Å), UVM2 (λ2246 Å, FWHM = 498 Å), and/or UVW2 (λ1938 Å, FWHM = 657 Å) filters (Poole et al. 2008). The observation log is detailed in Table 1. In total, Swift devoted 433.6 ks to this project.
We searched for X-ray emission from each target by building images from the event files (accumulating grade 0–12 events) and using the XIMAGE package with a S/N threshold for detection of 3σ (on average 0.0016 c s-1 or 5.5 × 10⁻¹⁴ erg cm2 s-1 assuming a thin thermal plasma with a temperature of 2 keV seeing through a 0.5 × 1022 cm-2 absorption column density). All sources were detected at their catalogue positions, which were inside the Swift/XRT error circles (about 3 arcsec in radius). We extracted source X-ray spectra, event arrival times and light curves from a circular region with a radius of 20 pixels (≈47′′) whose centroid we determined using the tool xrtcentroid. To correct for the presence of dead columns on the XRT CCDs during timing analysis of XRT data, we used the standard tool xrtlccorr. We extracted background events from an annular region with inner and outer radii of 25 and 40 pixels, respectively. We built the ancillary matrix (ARF) using the tool xrtmkarf and used the swxpc0to12s0_20070901v011.rmf response matrix provided by the Swift calibration team. We searched for periodic modulations in the X-ray light curves by calculating the  statistic (Buccheri et al. 1983) from source event arrival times in the frequency range fmin = 1/Tspan to fmax = 1/(2tframe) with a step Δf = A/Tspan, where Tspan is the difference between the last and first event arrival time (see Table 1 for a list of exposure times and number of visits), tframe the readout time (2.5073 s for the Swift/XRT/PC), and A = 50 the oversampling factor.
During each visit, Swift also obtained UVOT exposures in image mode. From the pipeline-reduced data, using the uvotmaghist script, we extracted the source count rate for each exposure from a circular region of 5′′ radius and background from an annular region of 10′′ and 20′′ inner and outer radii respectively. For those objects that were not detected in individual exposures, we added the exposures using the uvotimsum tool to improve the detection efficiency and extracted the count rate or its upper limit using the uvotsource tool. No period search was performed on the UVOT data because of the small number and scarcity of the exposures on each object. We quantified the stochastic variability in the UVOT light curves by comparing the expected standard deviation from Poisson statistics only (sexp) with the measured standard deviation (s) during each visit.
3. Survey results
Our survey detected X-ray emission from ten sources, with spectra spanning the range of known X-ray characteristics observed in WD symbiotics. In the ultraviolet, unlike at optical wavelengths, we detected strong flickering in most of the sources in our sample.
3.1. X-ray data
The XRT detected 10 out of 41 targets in our survey, and all of the detected sources had X-ray spectra consistent with thermal emission. The soft X-ray component extends up to energies of approximately 2 keV. Detecting optically thick emission up to such energies would require very high temperatures, implying super-Eddington luminosities. For example, one of the highest temperatures detected was during the supersoft phase of the recurrent nova U Sco, with a temperature of approximately 85 eV. The X-ray spectrum extends up to approximately 1.4 keV (Orio et al. 2012). We therefore conclude that the soft X-ray emission detected in the sources from our survey is due to optically thin thermal plasma. From the ten detections, one source was confirmed as a supersoft source while the remaining nine were detected at energies that exceeded 2.4 keV, with 0.3−10.0 keV count rates ranging from 0.0017 to 0.026 counts s-1. The spectra hint at the presence of unresolved emission lines in the ~1−2 keV (e.g., S XV, S XVI, Si XIII, Si XIV, Mg XII, Mg XI) and ~6.4 keV regions (e.g., Fe Kα, Fe XXV, Fe XXVI) consistent with the presence of optically thin thermal emission. We did, however, test models of absorbed optically thick Compton plasmas (usually used to model the X-ray spectrum of symbiotic X-ray binaries; see, e.g., Masetti et al. 2007b) which were discarded because the values of the plasma temperature were unrealistically high.
The hardness ratios of the WD symbiotics with detectable emission above 2.4 keV ranged from r = 0.14 to 9.85 (where we define r as the ratio of count rates at 2.4−10.0 keV and 0.3−2.4 keV energy ranges). The X-ray spectra (Fig. 1) are consistent with optically thin thermal emission for all of the X-ray sources (other than StHα 32), with four sources showing two distinct spectral components (NQ Gem, ZZ CMi, V347 Nor, and UV Aur) and five showing a single dominant spectral component (Hen 3-461, CD-28 3719, ER Del, BI Cru, and SWIFT J171951.7-300206). Because of the low number of counts, we used the C statistic (Cash 1979) throughout the spectral fitting procedure of the unbinned data. To determine whether the model fit the data appropriately, we calculated the goodness of fit as implemented in Xspec (Arnaud 1996), which simulates spectra many times based on the model and returns the number of simulations that have a fit statistic lower than that of the data. Ideally, if approximately 50% of the simulations have a fit statistic lower than that from the data, then the data are well-reproduced by the model. However, some problems have been reported when fitting spectra with less than 100 counts in total (Arnaud et al. 2011). For those objects that we detected with less than ≈100 counts, we used visual inspection of the fit residuals to distinguish between two basic models, an absorbed optically thin thermal plasma or an absorbed non-thermal power law. In order to test the significance of using multi-component models (i.e., two-temperatures plasma) instead of single-component models to fit the spectrum, we followed the procedure to calculate the likelihood ratio test (LRT) described in Protassov et al. (2002) and implemented in XSPEC. The LRT yields the percentage of the simulations (1000 in our case) that have a statistic (calculated as the difference between the C-stat value for the multi-component and the one for the single-component models) greater than or equal to that from fitting the data. Small values of the LRT indicate that the multi-component model is a more accurate representation of the data than the single-component model and that the presence of a second spectral component cannot arise purely from Poisson counting statistics. Table 2 lists the resulting parameters of the spectral fitting for each object. All fit parameters are quoted at a 90% confidence limit. We did not detect periodic modulation in the X-ray light curves in any source of our sample. The observations were sensitive to pulsed fractions of 44% (for NQ Gem, from which we detected the largest number of photons) or more.
X-ray spectral fitting results.
3.2. UVOT data
The Swift telescope detected the vast majority of our survey sources (37 out of 41) in the UV with a significance of at least 3σ. The WD symbiotics UV Aur, RW Hya, and StHα 190 saturated the UVOT detector so no useful UV data are available, V850 Aql, V503 Her, StHα 55, and NSV 05572 were not detected with a 3σ upper limit of mUVM2 ≳ 21.95, SWIFT J171951.7-300206 lies inside the saturated-PSF wings of a nearby (approximately 10 arcsec away) source and was only detectable after combining the individual exposures during each visit, thus we only list the average count rate in Table 3. Of the 33 sources with non-saturated UV detections, 21 displayed rapid variability with an rms amplitude more than twice that expected from Poisson statistics alone in at least one UV light curve segment; the rms amplitudes for these sources with unambiguous UV variability ranged from a few percent to more than 20%. For the other 12 sources with non-saturated UV detections, the rms variability amplitude was poorly constrained in some cases (i.e., when the count rate was low), but constrained to be less than about one percent for others (see Figs. 2 and 3). Comparing the UV variability amplitude with the X-ray hardness ratio revealed that sources with the hardest X-ray spectra have the largest UV variability amplitudes (see Sect. 5). The observed (s) and expected (sexp) standard deviations, the fractional rms variability amplitudes (on time scales of a few thousands seconds, given by the duration of each exposure), and upper limits are listed in Table 3.
 |
Fig. 2 Swift UVOT light curves of X-ray detected sources (except for UV Aur that saturated the UVOT detector and SWIFT J171951.7-300206 that was only detectable after combining the individual exposures during each visit, see Sect. 3). We show the starting time of the observation, T0, in units of MJD. The x-axis has units of 103 seconds after T0. The values in the y-axis are the fluxes normalized by the average flux of the observation. Those visits with fewer than three exposures are not shown. On each panel, we also show the X-ray spectral types (see Sect. 5) proposed for each source. |
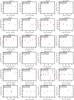 |
Fig. 3 Swift UVOT light curves of sources that did not produce detectable X-ray emission. We show the starting time of the observation T0 in units of MJD. The x-axis has units of 103 seconds after T0. Those visits with less than three exposures are not shown. |
 |
Fig. 3 continued. |
4. Individual objects
4.1. NQ Gem
The star NQ Gem is listed as a suspected symbiotic star in the catalogue of Belczyński et al. (2000) because it shows a ratio of SiIII]/CIII] that is similar to that of other symbiotic stars. An orbital solution was presented by Carquillat & Prieur (2008), who found a period of 1308 days, an eccentricity e = 0.182, and a lower limit on the white dwarf mass of 0.6 M⊙. The similarity of the optical spectra of NQ Gem and T CrB was noted by Greene & Wing (1971).
The X-ray spectrum of NQ Gem clearly shows two components at energies above and below ≈1.5 keV, respectively. This spectrum bears a striking resemblance to that of the well-known WD symbiotic CH Cyg (Mukai et al. 2007). Because of this similarity, we applied an analogous model. We fit the spectrum with a hard thermal component (kT1 ≳ 16 keV) seen through a simple absorber (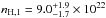 cm-2) and the soft component with an absorbed (nH,2 ≲ 0.1 × 1022 cm-2) low-temperature plasma (
 keV). From the calculation of the LRT (see Sect. 2) we found that only 18% of the simulations produce a statistic greater than or equal to that from fitting the data and we conclude that the two-component model is a more appropriate description of the spectrum. The unabsorbed flux is FX[0.3−10 keV] = 6.7
 erg cm-2 s-1, and the luminosity at 1 kpc (the actual distance is unknown) is LX[0.3−10 keV] = 8.0
 erg s-1 (d/1 kpc)2.
4.2. UV Aur
The UV Aur system is composed of UV Aur A and UV Aur B: UV Aur A is carbon Mira-type variable that is approximately 3.4′′ from UV Aur B, a B8.5-type star (Herbig 2009). Our UVOT observation of UV Aur saturated the detector, which saturates for sources brighter than approximately 7.4 visual magnitudes. As UV Aur A has a magnitude in the range of 7.4−10.6 while UV Aur B has a magnitude of about 11.5 (Herbig 2009), we conclude that the UVOT detected UV Aur A instead of UV Aur B. After the detection of [O III], [Ne III] and [Fe VII] (Sanford 1949, 1950; Seal 1988; Ikeda & Tamura 2004), UV Aur A was classified as a symbiotic star, but given the non-detection of He IIλ4686 Å, Herbig (2009) concluded that UV Aur A would not be qualified as a normal symbiotic. Nevertheless, the fact that the emission lines of [O III], etc., were detected at all is evidence that UV Aur A is probably a symbiotic system.
The X-ray spectrum shows two independently absorbed components, with most of the flux concentrated in the soft component. The LRT test yields values of 37% when comparing the statistics from a single- and a two-component spectral model. We modeled the softer region of the spectrum with a weakly absorbed (nH,1 ≲ 1020 cm-2) two-temperature plasma (kT1 ≲ 0.12 keV;  keV), and the hard region was modeled with a heavily absorbed (
 cm-2) plasma (kT3 ≳ 2 keV). The unabsorbed flux is
  erg cm-2 s-1. At a distance of 1 kpc (Herbig 2009), the unabsorbed X-ray luminosity is
  erg s-1 (d/1 kpc)2.
4.3. ZZ CMi
Although Belczyński et al. were ambivalent about whether ZZ CMi is a symbiotic star, the similarities between the properties of the X-ray and UV emission from ZZ CMi and those of other well-established WD symbiotics leads us to conclude that it is indeed a WD symbiotic. Belczyński et al. (2000) noted that the optical colors do not evolve like those of other symbiotics, that the optical emission line strengths are unusual (Hγ > Hβ), and that the maximum ionization potential could be as low as 35.1 eV, but the source definitely contains a late-type star and displays an emission-line optical spectrum, and the Hα profile is similar to that of other WD symbiotics. Since some WD symbiotics with very hard X-ray spectra can have optical spectra that appear to be only weakly symbiotic, ZZ CMi could provide another example of the different views of WD symbiotics provided by X-ray and optical observations.
As in the case of NQ Gem, the X-ray spectrum from ZZ CMi closely resembles the spectrum from CH Cyg, with two components primarily above and below ≈2 keV. The LRT indicates that only in 21% of the simulations was a simpler model acceptable over the more complex model that we used. Therefore we applied a similar spectral model to the one used for NQ Gem consisting of a weakly absorbed (nH,1 ≲ 0.2 × 1022 cm-2) optically thin thermal plasma ( keV) to model the softer energies plus an absorbed (
 cm-2) optically thin plasma (kT2 ≳ 2.7 keV) at higher energies. The unabsorbed flux is
  erg cm-2 s-1, and the luminosity at 1 kpc is
  erg s-1 (d/1 kpc)2.
4.4. ER Del
Although the spectral type of the cool component in ER Del is S5.5/2.5 (Ake 1979), which is relatively rare for a symbiotic star (Van Eck & Jorissen 2002), the optical and UV emission lines (Belczyński et al. 2000) support a symbiotic-star classification. In symbiotic stars that contain S stars, the ZrO bands in the spectrum of the red giant indicate that the red giant has been polluted by mass transfer from the companion (Van Eck & Jorissen 1999). The UV emission lines have ionization potentials as high as 47.9 eV, and the optical spectrum shows emission lines of H (Belczyński et al. 2000). Moreover, Jorissen et al. (2012) recently determined an orbital period for ER Del of 2089 ± 6 d. These features would suggest that ER Del is indeed a symbiotic binary.
The small number of photons detected (36 photons in a 10.6 ks exposure time) did not allow us to perform a precise fit. We applied a simple model consisting of an absorbed ( cm-2) optically thin thermal plasma (kT ≳ 10 keV). The unabsorbed flux is
  erg cm-2 s-1, and the luminosity at 1 kpc is
  erg s-1 (d/1 kpc)2. The large value of the absorbing column is indicated by the low count rate below ≤2 keV.
4.5. Hen 3-461
The star Hen 3-461 was classified as a suspected symbiotic in the catalog of Allen (1984). Its optical spectrum shows a late-type continuum with prominent TiO bands and emission lines from the Balmer series, He I, [Ne III], [O III], and [FeVII]. The optical spectrum of Hen 3-461 resembles the spectrum of RT Cru and T CrB in quiescence (Pereira et al. 1998), with a strong red continuum and weak Balmer lines. Little is known about this source at other wavelengths.
The X-ray spectrum of Hen 3-461 (Fig. 1) is similar to the spectrum of RT Cru (Luna & Sokoloski 2007; Kennea et al. 2009) in that it consists of a highly absorbed, strong continuum extending to high energies. Assuming a simple model consisting of an absorbed, optically thin thermal plasma, we find  cm-2 and
  keV. This model has a unabsorbed flux
  erg cm-2 s-1. Taking a more complex model, similar to RT Cru and T CrB(Luna & Sokoloski 2007; Luna et al. 2008), which consists of an absorbed multi-temperature cooling flow plasma, we find a lower limit for the maximum temperature for the cooling flow component of kTmax ≳ 3.4 keV and solar abundances (Anders & Grevesse 1989). In the complex model, the absorber has two components, one that completely covers the X-ray source (nH(full) =
  cm-2) and one that only partially covers it (nH(partial) = 10
 cm-2, with a covering fraction of 0.87
 ). Assuming a distance of 1 kpc, the resulting mass accretion rate is Ṁ ≲ 4 × 10⁻⁹M⊙/yr (d/1 kpc)2. The measured unabsorbed flux is
  erg cm-2 s-1 and so the luminosity is
  erg s-1 (d/1 kpc)2. The difference in the flux from the one-temperature model and the cooling flow can be attributed to the difference in the amount of absorption.
4.6. CD -28 3719
The symbiotic nature of CD -28 3719 has been suggested based on its broad Hα profiles and blue colors (Belczyński et al. 2000 and references therein). With an exposure time of 10.2 ks, we detected 30 X-ray photons from CD -28 3719. We fit the spectrum with a simple model composed of a highly absorbed ( cm-2) plasma with a temperature of kT ≳ 11 keV. The unabsorbed flux is
  erg cm-2 s-1, and the luminosity at a distance of 1 kpc is
  erg s-1 (d/1 kpc)2. Although the low number of photons precludes a more precise fit, the lower limit on nH requires the spectrum to be highly absorbed.
4.7. StHα 32
The star StHα 32 is a known supersoft source (Bickert et al. 1996; Orio et al. 2007) and it was included by accident in our target list. However, no X-ray spectrum has been published in the literature until now. Based on a method to determine the probability of 2MASS (Two Micron All Sky Survey) and ROSAT sources being associated, Haakonsen & Rutledge (2009) determined a probability of 0.721 that StHα 32 is associated with the symbiotic source 2MASS J0437456-0119118 (see Haakonsen & Rutledge 2009 for details about the method used). The system StHα 32 belongs to the small group of barium-rich symbiotics, i.e., systems that exhibit symbiotic features such as H I and He II in their optical and UV spectra and barium-star-type abundance anomalies (Schmid 1994).
Given that Swift/XRT detected only 31 photons from StHα 32, all with energies less than or equal to 0.4 keV, we only obtained approximated values for the parameters of the spectral model. We fit the spectrum with a blackbody model with a temperature of  keV (absorption was negligible). The flux is
  erg cm-2 s-1 and at a distance of 1 kpc, the luminosity is
  erg s-1 (d/1 kpc)2. Most known supersoft sources have luminosities in the 1035−36 erg s-1 range (see, e.g., Orio et al. 2007); therefore, it is possible that StHα 32 is farther away, probably in the galactic halo, as proposed by Schmid & Nussbaumer (1993), based on the small reddening toward the source, its galactic coordinates (l = 197°, b = −30°), and radial velocity (vr = 325 km s-1).
4.8. BI Cru
The symbiotic system BI Cru is comprised of a Mira-type red giant with a pulsation period of 280 days, an accreting white dwarf, and a bipolar nebula that extends 1.3 pc from the central binary perpendicular to the orbital plane (Contini et al. 2009). The bipolar structures (expanding at ≈200 km s-1) could be explained by the presence of an accretion disk and periodic hydrogen shell flashes on the surface of the white dwarf (with flashes every ~1000 yr; Corradi & Schwarz 1993). In their model of an optical spectrum taken in 1974, Contini et al. (2009) proposed that shocks in the inner nebula (from an unrecorded outburst) could be fast enough, with speeds of a few thousands km s-1, to produce X-ray emission. If these shocks produced the X-ray emission that we observed, they either must not have had time to cool or must have been fed by more recent mass ejections.
We fit the X-ray spectrum with a simple model of an absorbed (nH ≲ 0.3 × 1022 cm-2) optically thin thermal plasma (kT ≳ 5 keV) with non solar (≳2) Ne abundance. The total unabsorbed flux is  erg cm-2 s-1 and at a distance of 2 kpc (McCollum et al. 2008) the luminosity is
  erg s-1 (d/2 kpc)2. The residuals at energies of about 1 and 6 keV (see Fig. 1) suggest that the X-ray emission could arise from a multi-temperature plasma, however based on the LRT test, there is not significant improvements in the statistic when using multi-component spectral models.
4.9. V347 Nor
The star V347 Nor is a symbiotic with a Mira-type red giant (Belczyński et al. 2000). It shows an extended nebula discovered by Munari & Patat (1993). Santander-García et al. (2007) determined a distance of 1.5 ± 0.4 kpc using the expansion parallax method. Based on the similarity of the X-ray spectrum with CH Cyg, we fit the X-ray spectrum with a two-component model. The LRT test indicates that only 13% of the simulations yielded a statistic equal to or smaller than the statistic from a two-component model. We used two optically thin thermal plasmas: a low temperature plasma ( keV) and a highly absorbed (nH ≳ 16 × 1022 cm-2) high temperature plasma (kT2 ≳ 2.5 keV). The unabsorbed flux is
  erg cm-2 s-1, and the luminosity at 1.5 kpc is
  erg s-1 (d/1.5 kpc)2.
4.10. SWIFT J171951.7-300206, a newly discovered symbiotic in the field of IGR J17197-3010
In February 2012, Swift/XRT detected an X-ray source at the coordinates α = 17h19m51.7s and δ = −30°02′0.6′′(with an error radius of 4.3′′, Luna et al. 2012). These XRT coordinates are consistent with the position of a symbiotic star at α = 17h19m51.83s and δ = −30°02′0.3′′(Masetti et al. 2012). We therefore use the Swift naming convention and hereafter refer to this symbiotic as SWIFT J171951.7-300206. Although Masetti et al. (2012) proposed that this symbiotic star might be the counterpart to the γ-ray source IGR J17197-3010, Luna et al. (2012) concluded that the location of the two X-ray sources in the Swift/XRT field of the γ-ray source did not support the association between the symbiotic star and the γ-ray source. Therefore, although WD symbiotics have been known to produce γ-rays (e.g., Masetti et al. 2005), SWIFT J171951.7-300206 appears unlikely to have done so.
The XRT spectrum of SWIFT J171951.7-300206 extends up to approximately 5 keV. We model the spectrum with an absorbed (nH ≲ 0.1 × 1022 cm-2) two-temperature plasma ( keV and kT2 ≳ 3 keV). The LRT test indicates that in 33% of the simulations the statistic of a single-component model was equal to or smaller than the statistic of a two-component model. The unabsorbed flux is
  erg cm-2 s-1, and at a distance of 6.3 kpc (Masetti et al. 2012), the X-ray luminosity is
  erg s-1 (d/6.3 kpc)2.
5. Discussion and conclusions
We find that the X-ray spectra of newly discovered X-ray sources fall naturally into three groups. The first comprises those sources with highly absorbed, hard (E ≳ 2 keV) single-component X-ray spectra. The second includes sources with two distinct X-ray spectral components, one soft (E ≲ 2 keV) and one hard. The third group is made up of sources with soft, single-component X-ray spectra. As the α, β, and γ categorization introduced by Muerset et al. (1997) was based on ROSAT data, it naturally missed those WD symbiotics with hard, highly absorbed X-ray spectra. Moreover, the hard component of those systems with both soft and hard X-ray spectral components were also not detectable with ROSAT, and two-component X-ray spectra were thus also not included in this scheme.
We therefore propose an updated classification scheme for the X-ray spectra of symbiotic stars that builds upon and extends the previous scheme proposed by Muerset et al. (1997). We retain their α, β, and γ X-ray spectral classes and introduce a new category, that we have called δ, to identify those WD symbiotics with hard, highly absorbed X-ray spectra. Since WD symbiotics with both soft and hard components in their X-ray spectra share features of the β- and δ-types, we dub these systems β/δ. We summarize the groups as:
-
α:
Supersoft X-ray sources with most of the photons having energy less than 0.4 keV (all photons are detected below 1 keV). The likely origin is quasi-steady shell burning on the surface of the white dwarf (e.g., Orio et al. 2007).
-
β:
Soft X-ray sources with most of the photons having energy less than 2.4 keV, the maximum energy detectable with ROSAT. The likely origin is the collision of winds from the white dwarf with those from the red giant (Muerset et al. 1997).
-
γ:
Symbiotic stars with neutron-star accretors, also known as symbiotic X-ray binaries. Their X-ray spectra extend toward high energies (E ≳ 2.4 keV) and can be modeled as due to optically thick Comptonized plasma (e.g., Masetti et al. 2007a).
-
δ:
Highly absorbed, hard X-ray sources with detectable thermal emission above 2.4 keV. The likely origin is the boundary layer between an accretion disk and the white dwarf.
-
β/δ:
WD symbiotics with two X-ray thermal components, soft and hard. They share features of β and δ types. The soft emission is most likely produced in a colliding-wind region (Muerset et al. 1997), and the hard emission is most likely produced in an accretion-disk boundary layer (see Sect. 5.2).
X-ray spectral classifications of symbiotic stars.
 |
Fig. 4 Hardness ratio vs. count rate in counts s-1 for the hard X-ray WD symbiotics that have been observed with Swift. The new X-ray detected WD symbiotics are all located to the left of the dashed line, confirming that because of their low X-ray fluxes, they had not been detected before. The plot shows that δ-type sources (□) have a hardness ratio of more than 1 (above the dotted horizontal line); β-type sources (⋄) have hardness ratio of less than 1; and β/δ-type sources (△) are located above and below the hardness ratio =1 line. Hence, accretion-dominated δ-type objects lie above hardness ratio ≈1, while below this line we find soft X-ray sources whose X-ray spectra are dominated by emission originated in a colliding-wind region. |
Taking distance estimates into account, the detection rate of X-ray emission from WD symbiotics with Swift/XRT indicates that faint X-ray emission is a common, but not universal, property of symbiotic stars. Approximately 50% of the WD symbiotics have X-ray luminosities LX ≲ a few 1031 erg s-1 (see Table 2 and references in Table 4). Symbiotic stars constitute an important and growing population of X-ray sources (42 objects, see Table 4 for details), with 7 sources showing supersoft emission, 13 sources with soft thermal X-ray emission, 7 sources with soft and hard thermal X-ray emission, 6 sources with hard thermal X-ray emission, and 9 sources with hard non-thermal X-ray emission from accretion onto a neutron star. Since 6 of our 10 Swift X-ray detections came from the top 13 of the 41 on our fill-in target list (i.e., ~2/3 of our detections are from the top third of our list) that was sorted by a rough distance estimate, some of the non-detected objects (which have count rates of less than 0.0016 counts s-1) could have similar X-ray emission to the detections, but could simply be farther away. For example, the β/δ system CH Cyg would be categorized as δ-type if it were 10 times farther away and were observed during a high-flux state (the distance of CH Cyg is 245 pc and its flux varies between high and low states by factors of ≲10 below 2 keV and approximately 30 in the 3−10 keV band; see Table 1 in Mukai et al. 2007). During a low-flux state it would not be detected in a survey like the one presented here. The distance, however, cannot be the only factor in whether or not the XRT detected a source because we did not detect CI Cyg and RW Hya, for example, with distances of 1.5 and 0.68 kpc, respectively (Muerset et al. 1991).
5.1. β-type emission
Of the two scenarios that have been put forward as the origin of soft X-ray emission in the β- and β/δ-type systems, we prefer the scenario that invokes shock-heated plasma due to colliding winds. Two models have been proposed to explain the β-type emission from WD symbiotics: 1) colliding winds from the outbursting WD and red giant (Muerset et al. 1997) and 2) scattering of hard X-ray photons from near the surface of the WD into our line of sight (Wheatley & Kallman 2006). The scattering model proposed by Wheatley & Kallman (2006) required that the binary be seen almost edge-on. Since it is unlikely that all four of the new two-component WD symbiotics are edge-on, the Swift data support the colliding winds model over the scattering model for the β component in the X-ray spectra of WD symbiotics. The colliding winds model, as introduced by Muerset et al. (1997), requires the systems to be in an outburst state, so a wind from the WD can be driven. As none of our newly discovered sources seem to have experienced, to our knowledge, a recent outburst, a colliding winds model would also seem unlikely. However, the β-type WD symbiotic EG And was detected by ROSAT, although there was no evidence of any outburst. Futhermore, Vogel (1993) found that the observed UV line profiles can be explained by a wind from the WD in quiescence. We acknowledge that the evidence of winds from a quiescent WD comes from only one object (EG And) so far; however, some (or maybe all) sources with β-type X-ray emission in our sample have a colliding-winds region with the WD being in quiescence, constituing an increase in the previous single-object sample.
Another possibility, not yet fully explored in symbiotic stars, is the presence of a wind from the accretion disk itself. High accretion rate, non-magnetic CVs (dwarf novae in outburst and nova-like systems) usually have an accretion disk wind (Drew 1997). It is likely to be line-driven, by analogy with O stars (Castor et al. 1975), where those stars with luminosity above ≈0.1% Eddington (where electron scattering force balances gravity) show outflows, because line scattering is ≈1000 times more effective (a factor known as force multiplier) than electron scattering. Proga et al. (1998) show that CV and protostar disks with luminosity effectively above Eddington (i.e., considering the force multiplier) will drive winds, and we have no reasons to think this would be different for symbiotic stars, although this will benefit greatly from theoretical models of accretion disk in symbiotic stars.
The luminosity from this colliding wind region for the new objects and CH Cyg, a well-known β-type system, are all commensurate (see Mukai et al. 2007) with LX [0.3 − 2.4 keV] ~1030 − 31 erg s-1. The temperatures obtained from spectral models of the soft component (a few tenths of a keV) suggest plasma heated by shocks at speeds of a few hundred km s-1 (assuming strong conditions we have  , where Tshock and vshock are the shock temperature and speed, respectively, mp the proton mass, and k the Boltzmann constant), which are roughly consistent with the speeds of outflows from WD symbiotics (Nichols et al. 2007; Galloway & Sokoloski 2004).
5.2. δ-type emission
We suggest that the hard X-ray emission in δ and β/δ systems is from accretion rather than quasi-steady nuclear burning or colliding winds. The high level of absorption of the hard emission shows that these high-energy photons are emitted from well within the symbiotic wind nebula. The lack of any coherent modulation of the hard X-ray emission supports our idea that the hard emission is not due to magnetic accretion onto a rotating WD (albeit our data are only sensitive to pulsed fractions of more than ≈44%; see Sect. 3). The hard X-ray component of the spectrum is well-fit by thermal models with temperatures of a few keV, which are unlikely to be produced in the colliding region of low-velocity winds. The presence of variability on time scales of minutes to hours at UV wavelengths (see Fig. 2) supports the accretion scenario over quasi-steady nuclear burning, which varies on the much longer nuclear timescale (Sokoloski 2003). Figure 5 shows that sources with the hardest X-ray spectra (see Fig. 1) are also more UV variable (Fig. 2 and group at the upper-right corner in Fig. 5), while sources with low-amplitude UV flickering tend to have relatively little emission above 2 keV (lower-left corner group in Fig. 5). The UVOT light curve from our unintended observation of the supersoft source StHα 32 supports the proposed scenario in which sources powered by nuclear shell burning do not show large amplitude flickering (see Fig. 2 and Table 3). Moreover, unlike the WD symbiotics that produce δ-type X-ray emission, the X-ray faint sources SY Mus, CI Cyg, and RW Hya that were observed but not detected in our fill-in program (see Table 1) all have luminous WDs (a few hundreds to thousands L⊙; Muerset et al. 1991). Because the amount of energy released by nuclear burning material exceeds the energy released by accretion, these sources are most likely powered by nuclear-burning material on the surface of their white dwarfs, in contrast to the sources that we detect in hard X-rays, which we believe to be mostly accretion powered. If the UV flux from any WD with quasi-steady shell burning is strong enough to Compton cool the plasma in the boundary layer, that would explain the lack of δ-type emission from such WD symbiotics.
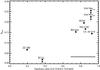 |
Fig. 5 Fractional rms amplitude of rapid UV variability (sfrac) vs. ratio of hard (2.4−10.0 keV) to total (0.3−10.0 keV) X-ray count rates. Objects with harder X-ray spectra tend to have more intense UV variability. Since rapid variability is a hallmark of accretion, this trend supports our proposition that the hard X-ray emission in WD symbiotics is powered by accretion. V347 Nor was observed with two UV filters, and we plot the fractional variability from each of the observations. Downward arrows indicate upper limits. The average error bar is shown at the bottom-right corner. |
The low X-ray fluxes (especially when compared to the UV fluxes) suggest that the boundary layers are predominantly optically thick in most cases, in contrast to non-magnetic CVs where the low-accretion rate systems have the highest ratio of X-ray-to-visual flux (Patterson & Raymond 1985). The UV-to-X-ray flux ratio is less than 1 from the almost entirely optically thin boundary layer in the δ-type WD symbiotic T CrB. The unabsorbed (using E(B−V)=0.15; Selvelli et al. 1992) flux in the UVOT/UVM2 filter is FUVM2 = 2.3 × 10⁻¹² erg cm-2 s-1, while the unabsorbed flux in the 0.3−10 keV from Swift/XRT data is FX = 3.8 × 10⁻¹¹ erg cm-2 s-1(these data are presented in Kennea et al. 2009). Interestingly, the UV-to-X-ray flux ratio for Hen 3-461 is ≳0.4, suggesting that most of its X-ray flux could also originate in a mostly optically thin boundary layer. Moreover, the spectral fit of a cooling flow model yielded a mass accretion rate Ṁ ≲ 4 × 10⁻⁹M⊙/yr (d/1 kpc)2 (see Sect. 4.5), which is within the regime of optically thin boundary layer emission around a 1 M⊙ white dwarf as computed by Narayan & Popham (1993). The luminosity of the δ spectral components from the objects listed in Table 2 (modulo uncertainties in the distances) ranges from 1031 erg s-1 (ZZ CMi) to 1032 erg s-1 (V347 Nor). For comparison, the luminosity from the accretion disk boundary layer in T CrB is on the order of 7 × 1033 erg s-1 (d/1 kpc)2(Luna et al. 2008), suggesting that in T CrB, the fraction of the boundary layer that is optically thin is greater than in the new systems.
Given that in symbiotics the reddening is usually derived from optical spectra (e.g., Luna & Costa 2005) and as the newly discovered WD symbiotics presented here are poorly known at optical wavelengths, reddening values are not available in the literature for most of them. We corrected the UV fluxes (see Table 2) for reddening of V347 Nor(E(B−V)=0.92; Santander-García et al. 2009), StHα 32(E(B−V)≲0.25; Schmid & Nussbaumer 1993) and BI Cru(E(B−V)=1.24; Pereira 1995). The UV-to-X-ray flux ratios (or its lower limit in the cases where reddening values are not available) support our conclusion about the optical depth of the boundary layer.
Because most of the boundary layers appear to be optically thick, and also because inverse Compton scattering could be cooling the plasma in the boundary layers, we cannot place tight constraints on the masses of the WDs in the symbiotics with newly detected X-ray emission. The hardness of the spectrum depends on the optical depth and temperature of the X-ray emitting plasma (Kylafis & Lamb 1982). The measured temperature can be smaller than the actual shock temperature if a significant portion of the boundary layer is optically thick.
Compton cooling of the post-shock region is important in some situations, and these situations have long been explored for magnetic CVs, in which the accretion proceeds vertically. The material in the post-shock region is cooling from the shock temperature and at temperatures of around 108 K (a few keV), the only important opacity source is electron scattering. For example, for accretion rates of a few 1016 gr s-1, a white dwarf with a mass of 0.5 M⊙ and an accretion fractional area f ~ 0.001, the optical depth for electron scattering τ is about 0.3−0.4 (see, e.g., Fujimoto & Ishida 1997), implying that approximately 30% of photons will Compton scatter. However, if there is a source of seed photons that are individually less energetic but more numerous than the electrons, then each electron will experience multiple Compton scattering events. Imamura & Durisen (1983) found that in order for Compton cooling to be important we need a source of seed photons (for example the WD surface itself), high local accretion rates (accretion rate per unit area), a geometry where photons cannot easily escape without interacting with electrons, and/or a high mass WD. If these conditions are met, then the post-shock plasma will cool down through Compton scattering until the density is high enough and the temperature is low enough that bremsstrahlung cooling will start to dominate. Then the temperature derived from spectral fit of a cooling flow model will be lower than the shock temperature, reflecting only the portion of the shock that is being cooled by bremsstrahlung emission. The same physical mechanism should also apply to the boundary layer of non-magnetic CVs and symbiotics, although a quantitative treatment is more difficult given our still limited understanding of the boundary layer. Nelson et al. (2011) found in their analysis of the quiescent X-ray emission from RS Oph, whose white dwarf is known to be massive and accreting at a high rate, that the shock temperature derived from the X-ray fits is 10% of what is expected from such a massive WD. By contrast, in T CrB, an otherwise similar system, the fit of the X-ray spectrum yields a shock temperature compatible with the WD mass (Luna et al. 2008). The temperatures derived from the X-ray fits, and the UV fluxes of the new objects presented here, suggest that they could still harbor massive white dwarfs powered by accretion rather than nuclear shell burning.
The new Swift/XRT detections of WD symbiotics do, however, allow us to place rough constraints on the rate of accretion onto the WDs in these systems. Accretion theory predicts that above a certain accretion rate, the nuclear burning occurs continuously (Iben 1982; Fujimoto 1982; Nomoto et al. 2007). If our conclusion is valid, namely that the sources with a δ component are powered by accretion rather than by nuclear shell burning, then the accretion rate in δ-type systems must be below this limit (of a few 10-8M⊙ yr-1 to a few 10-7M⊙ yr-1, depending on the WD mass). If the accretion proceeds through a disk and the boundary layer is optically thick, there is also a theoretical lower limit to Ṁ(for a particular WD mass; Popham & Narayan 1995). For MWD = 1.0, 0.8, and 0.6 M⊙, and for the X-ray emission to be from an optically thick boundary layer, these two theoretical considerations require that Ṁ is ≳10-7, a few ×10-8, and ~10-8M⊙ yr-1, respectively. The lower limit, however, suffers from theoretical uncertainties as it depends on the adopted viscosity parameter α. A change of about 30% in α implies a change of approximately a factor of 3 in the accretion rate at which the transition from optically thin to thick boundary layer occurs. Moreover, from observations of dwarf novae, Fertig et al. (2011) found that for a certain α the optically thin to thick transition in the boundary layer does not occur at the accretion rates predicted by Popham & Narayan (1995). Regardless of these uncertainties, our data suggest that mass transfer rates on the order of ~10-8M⊙ yr-1 are rather common in symbiotics and consistent with expectations from the Bondi-Hoyle accretion rate of ṀBH ~ 10-8M⊙ yr-1 (M/0.6 M⊙)2 (7 km s-1/v∞)3, where v∞ is the relative velocity of the red giant wind at the white dwarf.
5.3. β/δ-type X-ray spectra
β/δ-type X-ray spectra are present in approximately 20% of the WD symbiotics, and could be associated with the production of bi-polar outflows. The new β/δ systems that we have discovered with Swift, NQ Gem, ZZ CMi, V347 Nor, and UV Aur, have spectra that resemble the well-known X-ray spectra from the WD symbiotics CH Cyg and R Aqr, suggesting that although this X-ray spectral type was previously thought to be unusual, it is actually common. If these four new objects had been observed with ROSAT, they would have been classified as β-type in the scheme of Muerset et al. (1997). However, these objects also display a hard X-ray component characteristic of δ-type systems (see above). Therefore, we revise the Muerset et al. (1997) classification scheme and categorize two-component X-ray spectra as β/δ type.
An interesting similarity between the recently discovered β/δ-type WD symbiotic V347 Nor and the previously known β/δ-type CH Cyg and R Aqr is that all have extended bi-polar outflows (e.g., Corradi et al. 1999). The luminosity of the β component in our newly discovered β/δ-type WD symbiotic, however, is higher than the luminosity (in the 0.3−1 keV energy range) of the jet components in CH Cyg and R Aqr. The β components of V347 Nor has luminosity of approximately 5 × 1030 (d/1.5 kpc)2. In turn, the jet component in CH Cyg has a luminosity of 5 × 1028 erg s-1 (d/245 pc)2(Karovska et al. 2007); the NE jet in R Aqr has a luminosity of 7 × 1029 erg s-1; and the SE jet has a luminosity of 2 × 1029 erg s-1(Nichols et al. 2007). Thus, the jet emission in β/δ-type WD symbiotics is not contributing significantly to the flux of the β component. Moreover, both CH Cyg and R Aqr have spatially unresolved β-type emission that is much stronger than the jet emission. Then, the β-type emission seems to be either from the inner, spatially-unresolved portions of the jet or from some other source of emission that preferentially appears when jets are present. Although not yet observed with sensitive hard X-ray detectors, our findings suggest that V1016 Cyg and HM Sge, both symbiotic binaries with outflows detected in optical, could also be β/δ-type systems.
5.4. Conclusions
-
1.
X-ray emission is a common feature ofWD symbiotics. That X-rays have beenpreferentially detected from nearby sources, 25% of knownWD symbiotics, suggest such emission isprevalent.
-
2.
The X-ray spectra of WD symbiotics show three distinct spectral components: α, which is associated with quasi-steady shell burning; β, which is most likely from colliding winds; and δ, which we propose is from the innermost accretion region. β- and δ-type X-ray emission are often, but not always, found together.
-
3.
The UV-to-X-ray flux ratio of the δ-type targets reveals that the innermost accretion region, which is probably a boundary layer in most cases, is often optically thick, as expected for 0.6 M⊙ WDs accreting at the Bondi-Hoyle rate of ≈10-8M⊙/yr.
-
4.
Although most WD symbiotics do not produce detectable optical flickering on time scales of minutes, rapid UV flickering, presumably associated with accretion, is pervasive.
Online material
Observing log.
UVOT timing analysis results.
Acknowledgments
We thank the anonymous referee for comments and suggestions which improved the final quality of this article. We acknowledge the Swift team for planning these observations. G. J. M. Luna is a member of the CIC-CONICET (Argentina) and acknowledges support from grants PIP-Conicet/2011 #D4598 and FONCyT/PICT/2011 #269. J. L. Sokoloski acknowledges support from grants SAO GO1-12041A, NASA NNX10AK31G, and NASA NNX11AD77G. We thank N. Masetti and P. Evans for useful comments that helped to improve the manuscript.
References
- Ake, T. B. 1979, ApJ, 234, 538 [NASA ADS] [CrossRef] [Google Scholar]
- Alexander, R. D., Wynn, G. A., King, A. R., & Pringle, J. E. 2011, MNRAS, 418, 2576 [NASA ADS] [CrossRef] [Google Scholar]
- Allen, D. A. 1984, Proc. Astron. Soc. Aust., 5, 369 [NASA ADS] [CrossRef] [Google Scholar]
- Anders, E., & Grevesse, N. 1989, Geochim. Cosmochim. Acta, 53, 197 [Google Scholar]
- Arnaud, K. A. 1996, in Astronomical Data Analysis Software and Systems V, eds. G. H. Jacoby, & J. Barnes, ASP Conf. Ser., 101, 17 [Google Scholar]
- Arnaud, K., Smith, R., & Siemiginowska, A. 2011, Handbook of X-ray Astronomy, eds. R. Ellis, J. Huchra, S. Kahn, G. Rieke, & P. B. Stetson (Cambridge: Cambridge University Press) [Google Scholar]
- Baumgartner, W. H., Tueller, J., Markwardt, C. B., et al. 2013, ApJS, 207, 19 [NASA ADS] [CrossRef] [EDP Sciences] [Google Scholar]
- Belczyński, K., Mikołajewska, J., Munari, U., Ivison, R. J., & Friedjung, M. 2000, A&AS, 146, 407 [NASA ADS] [CrossRef] [EDP Sciences] [Google Scholar]
- Bickert, K. F., Greiner, J., & Stencel, R. E. 1996, in Supersoft X-Ray Sources, ed. J. Greiner (Berlin Springer Verlag), Lect. Notes Phys., 472, 225 [NASA ADS] [CrossRef] [Google Scholar]
- Bondi, H., & Hoyle, F. 1944, MNRAS, 104, 273 [NASA ADS] [CrossRef] [Google Scholar]
- Buccheri, R., Bennett, K., Bignami, G. F., et al. 1983, A&A, 128, 245 [NASA ADS] [Google Scholar]
- Byckling, K., Mukai, K., Thorstensen, J. R., & Osborne, J. P. 2010, MNRAS, 408, 2298 [NASA ADS] [CrossRef] [Google Scholar]
- Carquillat, J.-M., & Prieur, J.-L. 2008, Astron. Nachr., 329, 44 [NASA ADS] [CrossRef] [Google Scholar]
- Cash, W. 1979, ApJ, 228, 939 [NASA ADS] [CrossRef] [Google Scholar]
- Castor, J. I., Abbott, D. C., & Klein, R. I. 1975, ApJ, 195, 157 [NASA ADS] [CrossRef] [Google Scholar]
- Chaty, S., Rahoui, F., Foellmi, C., et al. 2008, A&A, 484, 783 [NASA ADS] [CrossRef] [EDP Sciences] [Google Scholar]
- Chernyakova, M., Courvoisier, T. J.-L., Rodriguez, J., & Lutovinov, A. 2005, ATel, 519, 1 [NASA ADS] [Google Scholar]
- Chiotellis, A., Schure, K. M., & Vink, J. 2012, A&A, 537, A139 [NASA ADS] [CrossRef] [EDP Sciences] [Google Scholar]
- Cieslinski, D., Elizalde, F., & Steiner, J. E. 1994, A&AS, 106, 243 [NASA ADS] [Google Scholar]
- Contini, M., Angeloni, R., & Rafanelli, P. 2009, MNRAS, 396, 807 [NASA ADS] [CrossRef] [Google Scholar]
- Corbet, R. H. D., Sokoloski, J. L., Mukai, K., Markwardt, C. B., & Tueller, J. 2008, ApJ, 675, 1424 [NASA ADS] [CrossRef] [Google Scholar]
- Corradi, R. L. M., & Schwarz, H. E. 1993, A&A, 268, 714 [NASA ADS] [Google Scholar]
- Corradi, R. L. M., Ferrer, O. E., Schwarz, H. E., Brandi, E., & García, L. 1999, A&A, 348, 978 [NASA ADS] [Google Scholar]
- Dilday, B., Howell, D. A., Cenko, S. B., et al. 2012, Science, 337, 942 [NASA ADS] [CrossRef] [Google Scholar]
- Di Stefano, R. 2010, ApJ, 719, 474 [NASA ADS] [CrossRef] [Google Scholar]
- Drew, J. E. 1997, in IAU Colloq. 163: Accretion Phenomena and Related Outflows, eds. D. T. Wickramasinghe, G. V. Bicknell, & L. Ferrario, ASP Conf. Ser., 121, 465 [Google Scholar]
- Eze, R. N. C., Luna, G. J. M., & Smith, R. K. 2010, ApJ, 709, 816 [NASA ADS] [CrossRef] [Google Scholar]
- Fertig, D., Mukai, K., Nelson, T., & Cannizzo, J. K. 2011, PASP, 123, 1054 [NASA ADS] [CrossRef] [Google Scholar]
- Fujimoto, M. Y. 1982, ApJ, 257, 767 [NASA ADS] [CrossRef] [Google Scholar]
- Fujimoto, R., & Ishida, M. 1997, ApJ, 474, 774 [NASA ADS] [CrossRef] [Google Scholar]
- Galloway, D. K., & Sokoloski, J. L. 2004, ApJ, 613, L61 [NASA ADS] [CrossRef] [Google Scholar]
- Gonçalves, D. R., Magrini, L., Munari, U., Corradi, R. L. M., & Costa, R. D. D. 2008, MNRAS, 391, L84 [NASA ADS] [CrossRef] [Google Scholar]
- Greene, A. E., & Wing, R. F. 1971, ApJ, 163, 309 [NASA ADS] [CrossRef] [Google Scholar]
- Haakonsen, C. B., & Rutledge, R. E. 2009, ApJS, 184, 138 [NASA ADS] [CrossRef] [Google Scholar]
- Herbig, G. H. 2009, AJ, 138, 1502 [NASA ADS] [CrossRef] [Google Scholar]
- Iben, Jr., I. 1982, ApJ, 259, 244 [NASA ADS] [CrossRef] [Google Scholar]
- Ikeda, Y., & Tamura, S. 2004, PASJ, 56, 353 [NASA ADS] [Google Scholar]
- Imamura, J. N., & Durisen, R. H. 1983, ApJ, 268, 291 [NASA ADS] [CrossRef] [Google Scholar]
- Ishida, M., Okada, S., Hayashi, T., et al. 2009, PASJ, 61, 77 [NASA ADS] [Google Scholar]
- Jorissen, A., Van Eck, S., Dermine, T., Van Winckel, H., & Gorlova, N. 2012, Balt. Astron., 21, 39 [NASA ADS] [Google Scholar]
- Kaplan, D. L., Levine, A. M., Chakrabarty, D., et al. 2007, ApJ, 661, 437 [NASA ADS] [CrossRef] [Google Scholar]
- Karovska, M., Schlegel, E., Hack, W., Raymond, J. C., & Wood, B. E. 2005, ApJ, 623, L137 [NASA ADS] [CrossRef] [Google Scholar]
- Karovska, M., Carilli, C. L., Raymond, J. C., & Mattei, J. A. 2007, ApJ, 661, 1048 [NASA ADS] [CrossRef] [Google Scholar]
- Kennea, J. A., Mukai, K., Sokoloski, J. L., et al. 2009, ApJ, 701, 1992 [NASA ADS] [CrossRef] [Google Scholar]
- Kenny, H. T., & Taylor, A. R. 2005, ApJ, 619, 527 [NASA ADS] [CrossRef] [Google Scholar]
- Kylafis, N. D., & Lamb, D. Q. 1982, ApJS, 48, 239 [NASA ADS] [CrossRef] [Google Scholar]
- Livio, M., & Warner, B. 1984, The Observatory, 104, 152 [NASA ADS] [Google Scholar]
- Luna, G. J. M., & Costa, R. D. D. 2005, A&A, 435, 1087 [NASA ADS] [CrossRef] [EDP Sciences] [Google Scholar]
- Luna, G. J. M., & Sokoloski, J. L. 2007, ApJ, 671, 741 [NASA ADS] [CrossRef] [Google Scholar]
- Luna, G. J. M., Sokoloski, J. L., & Costa, R. D. D. 2006, Ap&SS, 304, 283 [NASA ADS] [CrossRef] [Google Scholar]
- Luna, G. J. M., Sokoloski, J. L., & Mukai, K. 2008, in RS Ophiuchi (2006) and the Recurrent Nova Phenomenon, eds. A. Evans, M. F. Bode, T. J. O’Brien, & M. J. Darnley, ASP Conf. Ser., 401, 342 [Google Scholar]
- Luna, G. J. M., Sokoloski, J. L., Mukai, K., & Nunez, N. 2012, ATel, 3960, 1 [NASA ADS] [Google Scholar]
- Marcu, D. M., Fürst, F., Pottschmidt, K., et al. 2011, ApJ, 742, L11 [NASA ADS] [CrossRef] [Google Scholar]
- Masetti, N., Dal Fiume, D., Cusumano, G., et al. 2002, A&A, 382, 104 [NASA ADS] [CrossRef] [EDP Sciences] [Google Scholar]
- Masetti, N., Bassani, L., Bird, A. J., & Bazzano, A. 2005, ATel, 528, 1 [Google Scholar]
- Masetti, N., Orlandini, M., Palazzi, E., Amati, L., & Frontera, F. 2006, A&A, 453, 295 [NASA ADS] [CrossRef] [EDP Sciences] [Google Scholar]
- Masetti, N., Landi, R., Pretorius, M. L., et al. 2007a, A&A, 470, 331 [NASA ADS] [CrossRef] [EDP Sciences] [Google Scholar]
- Masetti, N., Rigon, E., Maiorano, E., et al. 2007b, A&A, 464, 277 [NASA ADS] [CrossRef] [EDP Sciences] [Google Scholar]
- Masetti, N., Munari, U., Henden, A. A., et al. 2011, A&A, 534, A89 [NASA ADS] [CrossRef] [EDP Sciences] [Google Scholar]
- Masetti, N., Parisi, P., Jiménez-Bailón, E., et al. 2012, A&A, 538, A123 [NASA ADS] [CrossRef] [EDP Sciences] [Google Scholar]
- McCollum, B., Bruhweiler, F. C., Wahlgren, G. M., Eriksson, M., & Verner, E. 2008, ApJ, 682, 1087 [NASA ADS] [CrossRef] [Google Scholar]
- Mikołajewska, J. 2007, Balt. Astron., 16, 1 [Google Scholar]
- Montez, Jr., R., Kastner, J. H., & Sahai, R. 2006, BAAS, 38, 1029 [NASA ADS] [Google Scholar]
- Muerset, U., Nussbaumer, H., Schmid, H. M., & Vogel, M. 1991, A&A, 248, 458 [NASA ADS] [Google Scholar]
- Muerset, U., Wolff, B., & Jordan, S. 1997, A&A, 319, 201 [NASA ADS] [Google Scholar]
- Mukai, K., Ishida, M., Kilbourne, C., et al. 2007, PASJ, 59, 177 [NASA ADS] [Google Scholar]
- Munari, U., & Patat, F. 1993, A&A, 277, 195 [NASA ADS] [Google Scholar]
- Munari, U., & Renzini, A. 1992, ApJ, 397, L87 [NASA ADS] [CrossRef] [Google Scholar]
- Narayan, R., & Popham, R. 1993, Nature, 362, 820 [NASA ADS] [CrossRef] [Google Scholar]
- Nelson, T., Mukai, K., Orio, M., Luna, G. J. M., & Sokoloski, J. L. 2011, ApJ, 737, 7 [NASA ADS] [CrossRef] [Google Scholar]
- Nespoli, E., Fabregat, J., & Mennickent, R. E. 2010, A&A, 516, A94 [NASA ADS] [CrossRef] [EDP Sciences] [Google Scholar]
- Nichols, J. S., DePasquale, J., Kellogg, E., et al. 2007, ApJ, 660, 651 [NASA ADS] [CrossRef] [Google Scholar]
- Nomoto, K., Saio, H., Kato, M., & Hachisu, I. 2007, ApJ, 663, 1269 [NASA ADS] [CrossRef] [Google Scholar]
- Orio, M., Zezas, A., Munari, U., Siviero, A., & Tepedelenlioglu, E. 2007, ApJ, 661, 1105 [Google Scholar]
- Orio, M., Behar, E., Gallagher, J., et al. 2012, MNRAS, 361 [Google Scholar]
- Patat, F., Chandra, P., Chevalier, R., et al. 2007, Science, 317, 924 [NASA ADS] [CrossRef] [EDP Sciences] [PubMed] [Google Scholar]
- Patterson, J., & Raymond, J. C. 1985, ApJ, 292, 535 [NASA ADS] [CrossRef] [Google Scholar]
- Pereira, C. B. 1995, A&AS, 111, 471 [NASA ADS] [Google Scholar]
- Pereira, C. B., Landaberry, S. J. C., & da Conceição, F. 1998, AJ, 116, 1971 [NASA ADS] [CrossRef] [Google Scholar]
- Podsiadlowski, P., & Mohamed, S. 2007, Balt. Astron., 16, 26 [NASA ADS] [Google Scholar]
- Poole, T. S., Breeveld, A. A., Page, M. J., et al. 2008, MNRAS, 383, 627 [NASA ADS] [CrossRef] [Google Scholar]
- Popham, R., & Narayan, R. 1995, ApJ, 442, 337 [NASA ADS] [CrossRef] [Google Scholar]
- Proga, D., Stone, J. M., & Drew, J. E. 1998, MNRAS, 295, 595 [NASA ADS] [CrossRef] [Google Scholar]
- Protassov, R., van Dyk, D. A., Connors, A., Kashyap, V. L., & Siemiginowska, A. 2002, ApJ, 571, 545 [NASA ADS] [CrossRef] [Google Scholar]
- Sanford, R. F. 1949, PASP, 61, 261 [NASA ADS] [CrossRef] [Google Scholar]
- Sanford, R. F. 1950, ApJ, 111, 270 [NASA ADS] [CrossRef] [Google Scholar]
- Santander-García, M., Corradi, R. L. M., Whitelock, P. A., et al. 2007, A&A, 465, 481 [NASA ADS] [CrossRef] [EDP Sciences] [Google Scholar]
- Santander-García, M., Corradi, R. L. M., & Mampaso, A. 2009, in Asymmetrical Planetary Nebulae IV, Proc., 555 [Google Scholar]
- Schmid, H. M. 1994, A&A, 284, 156 [NASA ADS] [Google Scholar]
- Schmid, H. M., & Nussbaumer, H. 1993, A&A, 268, 159 [NASA ADS] [Google Scholar]
- Seal, P. 1988, The Symbiotic Star UV Aurigae, eds. J. Mikolajewska, M. Friedjung, S. J. Kenyon, & R. Viotti (Dortrecht: Kluwer Academic Publishers), Astrophys. Space Sci. Lib., 145, 293 [Google Scholar]
- Selvelli, P. L., Cassatella, A., & Gilmozzi, R. 1992, ApJ, 393, 289 [NASA ADS] [CrossRef] [Google Scholar]
- Smith, R. K., Mushotzky, R., Mukai, K., et al. 2008, PASJ, 60, 43 [NASA ADS] [Google Scholar]
- Sokoloski, J. L. 2003, in Symbiotic Stars Probing Stellar Evolution, eds. R. L. M. Corradi, J. Mikolajewska, & T. J. Mahoney, ASP Conf. Ser., 303, 202 [Google Scholar]
- Sokoloski, J. L., & Bildsten, L. 2010, ApJ, 723, 1188 [NASA ADS] [CrossRef] [Google Scholar]
- Sokoloski, J. L., Kenyon, S. J., Espey, B. R., et al. 2006a, ApJ, 636, 1002 [NASA ADS] [CrossRef] [Google Scholar]
- Sokoloski, J. L., Luna, G. J. M., Mukai, K., & Kenyon, S. J. 2006b, Nature, 442, 276 [NASA ADS] [CrossRef] [PubMed] [Google Scholar]
- Stute, M., & Sahai, R. 2009, A&A, 498, 209 [NASA ADS] [CrossRef] [EDP Sciences] [Google Scholar]
- Stute, M., Luna, G. J. M., & Sokoloski, J. L. 2011, ApJ, 731, 12 [NASA ADS] [CrossRef] [Google Scholar]
- Stute, M., Luna, G. J. M., Pillitteri, I. F., & Sokoloski, J. L. 2013, A&A, 554, A56 [NASA ADS] [CrossRef] [EDP Sciences] [Google Scholar]
- Thompson, T. W. J., Tomsick, J. A., Rothschild, R. E., in’t Zand, J. J. M., & Walter, R. 2006, ApJ, 649, 373 [NASA ADS] [CrossRef] [Google Scholar]
- Tueller, J., Gehrels, N., Mushotzky, R. F., et al. 2005, ATel, 591, 1 [NASA ADS] [Google Scholar]
- Van Eck, S., & Jorissen, A. 1999, A&A, 345, 127 [NASA ADS] [Google Scholar]
- Van Eck, S., & Jorissen, A. 2002, A&A, 396, 599 [NASA ADS] [CrossRef] [EDP Sciences] [Google Scholar]
- Vogel, M. 1993, A&A, 274, L21 [NASA ADS] [Google Scholar]
- Wang, B., & Han, Z.-W. 2010, Res. Astron. Astrophys., 10, 235 [Google Scholar]
- Warner, B. 1995, Cam. Astrophys. Ser., 28 [Google Scholar]
- Wheatley, P. J., & Kallman, T. R. 2006, MNRAS, 372, 1602 [NASA ADS] [CrossRef] [Google Scholar]
- Wynn, G. 2008, in RS Ophiuchi (2006) and the Recurrent Nova Phenomenon, eds. A. Evans, M. F. Bode, T. J. O’Brien, & M. J. Darnley, ASP Conf. Ser., 401, 73 [Google Scholar]
All Tables
All Figures
|
Fig. 1 Swift/XRT spectra of the WD symbiotics with newly discovered X-ray emission together with their X-ray spectral types: NQ Gem, UV Aur, ZZ CMi, ER Del, Hen 3-461, CD-28 3719, StHα 32, BI Cru, V347 Nor, and SWIFT J171951.7-300206. The full line shows the best-fit model described in Sect. 3, while the dotted line shows the contribution of the individual spectral components in the case of multi-component models. The X-ray spectral classification for each source is included between parentheses in each panel and is listed in Table 4. |
| In the text | |
|
Fig. 2 Swift UVOT light curves of X-ray detected sources (except for UV Aur that saturated the UVOT detector and SWIFT J171951.7-300206 that was only detectable after combining the individual exposures during each visit, see Sect. 3). We show the starting time of the observation, T0, in units of MJD. The x-axis has units of 103 seconds after T0. The values in the y-axis are the fluxes normalized by the average flux of the observation. Those visits with fewer than three exposures are not shown. On each panel, we also show the X-ray spectral types (see Sect. 5) proposed for each source. |
| In the text | |
|
Fig. 3 Swift UVOT light curves of sources that did not produce detectable X-ray emission. We show the starting time of the observation T0 in units of MJD. The x-axis has units of 103 seconds after T0. Those visits with less than three exposures are not shown. |
| In the text | |
|
Fig. 3 continued. |
| In the text | |
|
Fig. 4 Hardness ratio vs. count rate in counts s-1 for the hard X-ray WD symbiotics that have been observed with Swift. The new X-ray detected WD symbiotics are all located to the left of the dashed line, confirming that because of their low X-ray fluxes, they had not been detected before. The plot shows that δ-type sources (□) have a hardness ratio of more than 1 (above the dotted horizontal line); β-type sources (⋄) have hardness ratio of less than 1; and β/δ-type sources (△) are located above and below the hardness ratio =1 line. Hence, accretion-dominated δ-type objects lie above hardness ratio ≈1, while below this line we find soft X-ray sources whose X-ray spectra are dominated by emission originated in a colliding-wind region. |
| In the text | |
|
Fig. 5 Fractional rms amplitude of rapid UV variability (sfrac) vs. ratio of hard (2.4−10.0 keV) to total (0.3−10.0 keV) X-ray count rates. Objects with harder X-ray spectra tend to have more intense UV variability. Since rapid variability is a hallmark of accretion, this trend supports our proposition that the hard X-ray emission in WD symbiotics is powered by accretion. V347 Nor was observed with two UV filters, and we plot the fractional variability from each of the observations. Downward arrows indicate upper limits. The average error bar is shown at the bottom-right corner. |
| In the text | |
Current usage metrics show cumulative count of Article Views (full-text article views including HTML views, PDF and ePub downloads, according to the available data) and Abstracts Views on Vision4Press platform.
Data correspond to usage on the plateform after 2015. The current usage metrics is available 48-96 hours after online publication and is updated daily on week days.
Initial download of the metrics may take a while.