Fig. 3
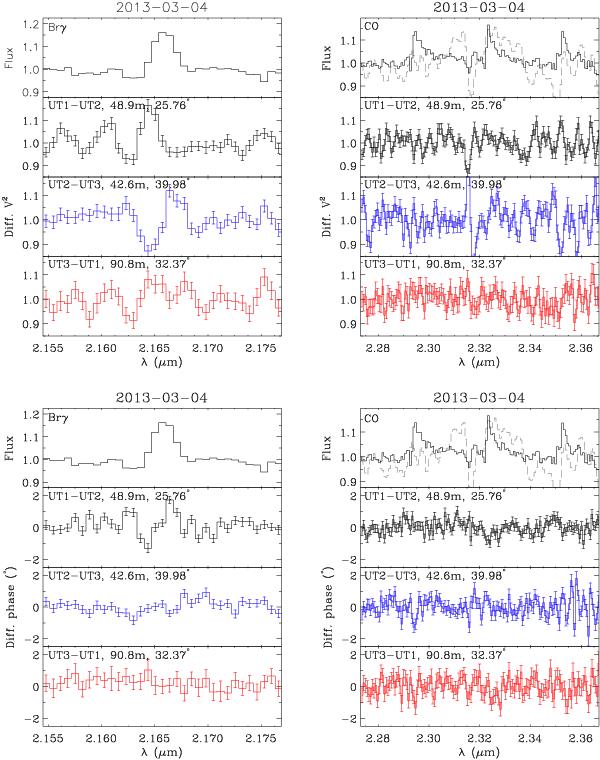
Time-averaged differential squared visibility (top) and differential phases (bottom) around the Brγ line (left) and CO first overtone bandhead emission (right). Error bars shown represent statistical errors on the mean. A frame selection of 20 per cent was used for the visibilities and a selection rate of 80 percent was employed to obtain the averaged phases. The individual AMBER files were merged before frame selection was conducted. The dashed line alongside the CO emission represents the spectrum before telluric correction.
Current usage metrics show cumulative count of Article Views (full-text article views including HTML views, PDF and ePub downloads, according to the available data) and Abstracts Views on Vision4Press platform.
Data correspond to usage on the plateform after 2015. The current usage metrics is available 48-96 hours after online publication and is updated daily on week days.
Initial download of the metrics may take a while.