| Issue |
A&A
Volume 558, October 2013
|
|
|---|---|---|
| Article Number | A93 | |
| Number of page(s) | 8 | |
| Section | Stellar structure and evolution | |
| DOI | https://doi.org/10.1051/0004-6361/201321798 | |
| Published online | 11 October 2013 | |
Interacting planetary nebulae
II. Galactic population and interaction models
1 Astronomy Dept, Faculty of Science, King Abdulaziz University, 21589 Jeddah, Saudi Arabia
e-mail: This email address is being protected from spambots. You need JavaScript enabled to view it.
2 Department of Astronomy, Faculty of Science, Cairo University, 12613 Cairo, Egypt
3 National Research Institute of Astronomy and Geophysics, 11421 Helwan, Egypt
4 Instituto de Astronomía y Meteorología, Departamento de Física, CUCEL, Universidad de Guadalajara, Av. Vallarta 2602, CP 44130 Guadalajara, jal., México
Received: 30 April 2013
Accepted: 16 July 2013
Abstract
In the present paper, we discuss the classification of planetary nebulae that show interaction with the interstellar medium in terms of Galactic population. Furthermore, we investigate the case of interaction of each object in the framework of the isothermal and adiabatic shock models and we derive the mean critical, leading, and stopping densities of the nebulae located in the Galactic thin and thick disks. A sample of 34 objects with available proper motions, radial velocities, and reliable distances in the literature was used for these purposes. The results show that 16 and 10 objects are classified as Galactic thin-disk and thick-disk populations, respectively. Seven objects are classified as probable thin-disk populations, and one as a probable thick-disk population. The flow and cooling time of the post-shock nebular gas are derived and the cooling/flow time ratio shows a linear correlation versus the Galactic height of the interacting planetary nebulae. The results reveal that there is a tendency for the interacting planetary nebulae belonging to the thin disk to follow an isothermal shock model, whilst those belonging to the thick disk to follow an adiabatic shock model.
Key words: planetary nebulae: general / methods: statistical
© ESO, 2013
1. Introduction
The study of the interaction between the planetary nebulae (PNe) and the interstellar medium (ISM) started to draw attention about 40 years ago. The possibility of deceleration of PNe expansion attributable to their surrounding ISM was first suggested by Gurzadyan (1969), while the first observational evidence of PN-ISM interaction came later with a study of Jacoby (1981), where he showed the unusual shape of the PN A35. Thanks to modern observational tools, the number of detected interacting planetary nebulae (IPNe) has increased during the last 20 years. Recently, Ali et al. (2012; hereafter Paper I) presented a list of 117 objects confirmed as interacting planetary nebulae. In Paper I, we discussed the morphological classification and the Galactic orientation of the interaction regions. The location of the object through the different Galactic components is roughly determined based on its Galactic scale height (Z).
The leading study on this topic was performed by Borkowski et al. (1990; hereafter BSS). They were able to show that the interaction takes place when the nebular density drops below a critical value, also known as the critical density, at which the pressures of the PN and the ISM become comparable. In their simple evolutionary model, the PN-ISM interaction process goes through three stages: free expansion, deceleration, and stripping off the central star. The strength of interaction between the PNe and the ISM depends on two parameters, the relative velocity between the PN and the ISM, and the ISM density. Both parameters are essential in the determination of the critical density (ncrit), leading density (nleading), stopping density (nstop), and the type of shock model. Here the leading density is the density in the nebular section that moves toward the direction of motion (i.e. the interacting rim), and the stopping density is the density in the nebular section opposite to the interacting rim (BSS). The analysis of the IPNe space coordinates (X,Y,Z) and velocity components (U,V,W) would help to derive their relative velocities and their Galactic positions within the different Galactic structures.
Soker & Dgani (1997) suggested that PNe moving at moderate velocities (VS ~ 60 km s-1) through relatively high ISM density are expected to create isothermal shock, while those moving with high velocity (VS ≳ 100 km s-1) through low ISM density are expected to create adiabatic shock as they interact with the ISM. This claim should be confirmed by doing a quantitative analysis on a sample of IPNe of known space velocities and Galactic positions.
Soker et al. (1991; hereafter SBS) also showed that the adiabatic model is subject to the Rayleigh-Taylor (RT) instability, while the isothermal model shows no sign of RT instability. Later on Soker & Dgani (1997) indicated that the ISM magnetic field can lead to RT instability in the isothermal model as well.
Peimbert (1978) classified the PNe into four types according to their chemical, spatial, and kinematic characteristics. Type I PNe are characterized by their excess in He and N abundance, where He/H ≥ 0.125 or log (N/O)≥ − 0.30 (Peimbert & Torres-Peimbert 1983). It has been suggested that they are created from the most massive progenitor stars in the PNe mass range, and consequently they should be associated with the thin Galactic disk and have low velocity dispersion. Type II PNe are older than type I and are defined as those objects with He/H < 0.125 and log (N/O)< − 0.30. Based on their N abundances, Faundez-Abans & Maciel (1987) divided the type II into IIa and IIb. These objects still belong to the thin Galactic disk. Peimbert (1978) defined the type III PNe for the high velocity objects (| Vp | > 60 km s-1) associated with the thick Galactic disk. These objects originate from older and less massive stars than types I and II, and therefore have underabundances of heavy elements. Type IV PNe represent Galactic halo objects characterized by low heavy element abundances and large velocity dispersion. Maciel (1989) introduced type V PNe to represent the Galactic bulge PNe. Maciel & Dutra (1992) derived a mean peculiar velocity (⟨ VP ⟩), the difference between the observed radial velocity corrected for local standard of rest (LSR) and the velocity determined from the Galactic rotation curve, of 21.2 ± 15.6 km s-1 for types I+II and 64 ± 45 km s-1 for type III. Quireza et al. (2007) re-analysed the kinematical criteria used to define the different Peimbert types and suggested that type I and II objects are associated with the Galactic thin disk, while type III objects are associated with the Galactic thick disk. They adopted VP < 60 km s-1 for thin-disk objects and VP ≥ 60 km s-1 for thick-disk objects.
In the present article we discuss the Galactic population classification of a sample of IPNe based on two different kinematical tools, and carry out a quantitative study for the interacting PNe in the framework of the isothermal and adiabatic shock models discussed by Dgani (2000). In addition, the mean critical, leading, and stopping densities in the nebular interacting region are derived for objects located in the thin and thick Galactic disks. We used the peculiar velocity to unveil the Galactic populations of some IPNe with doubtful classification according to the two kinematical tools presented in Sect. 4.
The article is structured as follows: Sect. 2 introduces the sample; the space coordinate and velocity components are given in Sect. 3; the Galactic populations of IPNe are discussed in Sect. 4; Sect. 5 deals with the derivation of the mean critical, leading, and stopping nebular densities in the thin and thick Galactic disks; the cooling and flow time post shocks are investigated in Sect. 6; and the last section presents the conclusions.
2. The sample
From paper I, we chose a sample of 34 objects with available proper motions, radial velocities, and distances in the literature.
Despite the huge effort astronomers make to determine the distances of PNe, particularly in the Galaxy, the subject still represents a challenge to them because of the problems of accuracy in their determination. The techniques for PNe distance measurements are classified into individual and statistical. In statistical methods, either it is assumed that one of the nebular parameters is constant for all PNe and at all stages of evolution, e.g. the Shklovsky method (1956), or it is based on an empirical relationship between two distance-dependent nebular parameters, e.g. the ionized mass and radius (Stanghellini et al. 2008; Philips 2001; Zhang et al. 1995). The statistical distances are less accurate, but they are measured for a larger number of PNe. On the other hand, few primary methods are considered to be independent ways of determining the distance, such as trigonometric parallax, spectroscopic parallax of the central star, cluster membership, reddening (extinction), gravity, and angular expansion. Some of these methods are more reliable than others, their estimated accuracies are different and lie in the range 10–45%. Ali et al. (in prep.) compared the different individual methods with the trigonometric approach, which represents the only direct way to measure the PN distance, and compared it to other methods for the nearest nebulae. The results show that all methods, except the gravity method, are comparable to the trigonometric method. Based on 17 common objects, they also found that the gravity distances overestimate the trigonometric distances by 42%. The same result is achieved by Napiwotzki (2001) and Pier et al. (1993), where they found that the distances measured with the gravity method overestimate those given with the trigonometric method by 33% and 40%, respectively.
Galactic coordinate (l, b), weighted distance (D), weighted proper motion (PM), and weighted radial velocity (RV) of the IPNe sample.
In the present work, we collect the individual distances for 34 objects, except two nebulae, from the literature. For the two nebulae HFG1 and M2-40, we estimated their statistical distances based on the distance scale given by Phillips (2001). For the objects that have multiple distance measurements, we determined for each the weighted mean distance and its uncertainty; however, some data points contribute more than others depending on their accuracies and the weighted mean distance value biased toward the more accurate distance measurements. By reviewing the sample, there are 10 objects with distances measured by a single individual method. The 24 remaining objects have their distances estimated via multiple methods. In Sect. 4, we present the effects of using different distance methods for each object on its Galactic population classification.
Table 1 lists the weighted mean and standard deviation values of the proper motion (PM), radial velocity (RV), and distance (D), as well as the references for all three parameters. The peculiar velocity of the present sample is derived according to the procedure outlined by Quireza et al. (2007), and the results are listed in Table 1. The expansion velocities are taken from Paper I. The interstellar densities (nISM) of the thin and thick Galactic disks are derived as a function of the height above the Galactic plane using Eq. (2) in the article by Ferrière (2001). This equation determines the ISM density for the cold and warm neutral hydrogen.
3. Space coordinates and velocity components
The two kinematical tools that we will use to determine the location of IPNe in the Galaxy are based on the space velocity components (U,V,W) and the Galactic height above and below the Galactic plane (Z). Here we derived the space coordinates X, Y, and Z (listed in Table 2), where the Sun is assumed to be at (X = 8.5 kpc, Y = 0.0, Z = 0.0), X is directed towards the Galactic anti-centre, and Z is directed towards the Galactic North Pole (Odenkirchen & Broche 1992). Using the absolute proper motions, radial velocities, and individual distances listed in Table 1, we determined the space velocity components U, V, and W, where U and V refer to the direction toward the Galactic centre and Galactic rotation in the Galactic disk, respectively, while W indicates the direction perpendicular to the Galactic disk. The velocity components were corrected for the LSR, then for the Galactic standard of rest (GSR). The LSR correction is considered by adopting the Sun’s peculiar motion (U⊙, V⊙, W⊙) = (10.0,5.25,7.17) km s-1 (Dehnen & Binney 1998), while the GSR correction is adopted using the IAU standard Galactocentric distance of the Sun (R⊙ = 8.5 kpc) and rotational solar velocity V(R⊙) = 220 km s-1. The velocity components and their associated errors are derived following the method given by Johnson & Soderblom (1987). The Galactic velocity components, total space velocity ( ), and their associated errors due to the formal errors of the proper motion, radial velocity, and distance are presented in Table 2. The space coordinates and the velocity components are set according to a galactocentric right-handed Cartesian coordinate system.
Derived space coordinates (X,Y,Z), velocity components (U,V,W), total space velocities (VS), and peculiar velocities (Vp) of the IPNe sample.
4. Galactic populations of IPNe
By reviewing the literature, we found a small number (10 objects) of Galactic IPNe identified as thin-disk or thick-disk populations. Kerber et al. (2004) identified the Galactic location (in thin and thick disk) of four IPNe by determining their Galactic orbits. Wu et al. (2011) have established the Galactic orbits of eight IPNe, two of which were previously discussed by Kerber et al. (2004). Nowadays there are available data that enable us to predict the Galactic locations for a larger sample of IPNe.
To study the Galactic population of our sample, we rely on two kinematical tools. The first one is known as the Toomre diagram presented by Bensby et al. (2003) and Bensby & Feltzing (2010), in which they analyse the abundances of F and G dwarf stars. According to the Toomre diagram, stars with total space velocity  km s-1 belong to the thin disk, and stars with 200 ≳ VS ≳ 70 km s-1 belong to the thick disk, while stars with VS > 200 km s-1 are halo. The second tool is the classical ULSR − VLSR velocity diagram given by Pauli et al. (2003) to discuss the kinematics of a sample of DA white dwarfs. Pauli et al. (2003) found, based on the ULSR − VLSR diagram, that the thin disk stars lie inside the 2σ velocity contour region, whereas the thick disk and halo stars lie in the region outside the 2σ velocity contour. Then they defined the halo star populations as the stars with velocities fulfilling the condition
  km s-1. The two criteria are used to distinguish between the three main Galactic components: thin disk, thick disk, and halo.
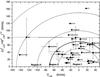 |
Fig. 1 Toomre diagram for the sample of interacting planetary nebulae. The x-axis represents the velocity component (V) in the direction of the galactic rotation, while the y-axis represents the velocity component defined by the galactic centre direction (U) and the direction perpendicular to the Galactic plane (W). All velocity components are corrected from LSR. The semi-circular lines indicate the constant total velocity in steps of 50, 70, 100, 150 km s-1. The error bars represent the standard deviation in velocity components for the IPNe with multiple determined distances. Regions I, II, and III refer to the objects with total velocities VS < 50 km s-1, 70 ≥ VS ≥ 50 km s-1, and VS > 70 km s-1, respectively. |
Applying the Toomre diagram, we found no object in our sample belonging to the Galactic halo. Figure 1 illustrates three regions I, II, and III. While region I and region III contain the Galactic thin-disk and Galactic thick-disk objects, respectively, region II contains objects with total velocity 70 ≳ VS ≳ 50 km s-1, which have the same probability of belonging to the thin or thick Galactic populations. Figure 1 shows that 13 IPNe (A21, A35, A74, A78, EGB 6, HFG1, IW1, NGC 3587, NGC 6629, NGC 6853, NGC 7293, S216, Ton 320) are lie in region I; 10 IPNe (A31, A36, DHW 5, IC 4593, K 2-2, NGC 40, NGC 6781, NGC 6891, PW 1, S174) are lie in region II; and 11 IPNe (A71, M 2-40, NGC 246, NGC 1360, NGC 6751, NGC 6826, NGC 7094, PG 1034+001, S68, S176, Tc 1) lie in region III.
The ULSR − VLSR diagram including data from our sample is presented in Fig. 2. We identify the objects clustered inside the 1σ-velocity contour as thin-disk members, whilst those in the region between the 1σ and 2σ velocity contours are either thin or thick members. Consequently, they are similar to the objects in region II of Fig. 1. As a result, 12 IPNe (A21, A35, HFG1, IW1, IC 4593, K 2-2, NGC 6853, NGC 7293, PW 1, S216, S176, Ton 320) belong to the thin disk; 8 IPNe (A71, M 2-40, NGC 1360, NGC 6826, NGC 7094, PG 1034+001, S68, Tc 1) belong to the thick disk; and 14 IPNe (A31, A36, A74, A78, DHW 5, EGB 6, NGC 40, NGC 246, NGC 3587, NGC 6629, NGC 6751, NGC 6781, NGC 6891, S174) are classified as either thin or thick members. We found no object in the Galactic halo. Comparing the results from Figs. 1 and 2, we found that eight objects are commonly classified as thin-disk populations, eight as thick-disk populations, and seven as thin or thick disk populations (see Table 3).
To define precisely the classification of the objects inside the thin or thick area and those showing contradictory classification according to the two criteria above, we introduced an estimator c. The concept of the estimator c is taken from Pauli et al. (2003) to distinguish objects in the different Galactic disk components. The estimator c is defined as the sum of the estimators cToomre, cUV, and cVP that are based on the position of the object in the Toomre diagram, in the ULSR − VLSR diagrams, and the value of the peculiar velocity of the object, respectively. We assign cToomre = + 1, 0, and − 1 for the object found inside regions I, II, and III (Fig. 1), respectively. The estimator cUV is defined as follows: cUV = + 1, 0, and − 1 for objects inside the 1σ velocity contour, between the 1σ and 2σ velocity contours, and outside the 2σ velocity contour (Fig. 2), respectively. We assign cVP = + 1 for objects with VP < 60 km s-1, and cVP = −1 for objects with VP ≥ 60 km s-1. The object is classified as a thin-disk population when c ≥ 2, while it is classified as a thick-disk population when c ≤ − 2. In addition, the object is classified as a probable thin-disk population when c = + 1 and as a probable thick-disk population when c = −1.
According to the value of the estimator c, the results reveal that another eight objects (A74, A78, EGB 6, IC 4593, K2-2, NGC 3587, NGC 6629, PW1) belong to the thin-disk; two objects (NGC 246, S176) belong to the thick disk; seven objects (A31, A36, DHW5, EGB NGC 40, NGC 6781, NGC 6891, S174) are probable thin-disk populations; and NGC 6751 is a probable thick-disk population.
In an attempt to evaluate the consequences of using different distance methods on the Galactic population classification of our sample, we calculated the velocity components for each object and for each distance method. We also derived the standard deviation for these velocity components (U,V,W). The standard deviation of the velocities are presented as error bars in Figs. 1 and 2. The results show that most of these objects have no noticeable change in their location with respect to the different Galactic structure. For the objects S68, NGC 3587, and Tc1, the uncertainties in their velocity components, especially the V-component, are extremely large, as shown by the length of their error bars (Figs. 1 and 2). The main reason is that their distance determination, which is based on the gravity method, is, as stated above, larger than that based on other methods by a factor of 2, 4, and 6 times, respectively (see the distances references in Table 1). Nonetheless, these objects show no substantial change in their population classifications. The two nebulae S68 and Tc1 are still associated with the Galactic thick disk (Figs. 1 and 2). The classification of NGC 3587 (Figs. 1 and 2) might change from a probable thick-disk population to a probable thin-disk population. Consequently, the weighted mean distances that are used in the present study are reliable.
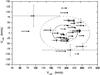 |
Fig. 2 ULSR − VLSR velocity diagram for the interacting planetary nebulae sample. The dotted ellipses are the 1σ and 2σ contours. The objects located outside the 2σ contour belong to the thick-disk populations, those inside the 1σ contour are thin-disk populations, and those between the 1σ and 2σ contours are classified as thin or thick populations. The error bars are defined as in Fig. 1. |
Our present results concerning the Galactic population classification agree well with the results of Wu et al. (2011), where they present the nebulae A21, NGC 7293, S216, and Ton 320 as Galactic thin-disk populations, and A31 and PG 1034+001 as Galactic thick-disk populations. They classified the PW1 nebula as a probable thick population, while we classified the object as a thin-disk population. They mentioned that its population classification is very uncertain because of the large errors in its orbital parameters. The nebula DHW5 is defined here as a probable thin-disk population, while it is defined as a thin-disk population in the analysis of Wu et al. (2011). The object lies inside the 2σ contour in the ULSR − VLSR diagram (Fig. 2), which according to Pauli et al. (2003) is defined as a thin-disk population member. Furthermore, its low galactic height (Z = 70 pc) favours a thin-disk population. Conversely, the high space velocity of the object (V = 63 km s-1) pledges for a thick-disk population. Our results also show a good agreement with those of Kerber et al. (2004), where they defined NGC 7293 and S216 as thin-disk populations. They classified IC 4593 as a probable thick disk, while we classified it as a thin-disk population. This discrepancy in classification could be due to the difference in the distance value (d = 1584 pc) used by Kerber et al. (2004), which is higher than the one we used (d = 971 pc). The object lies inside the 1σ velocity contour in the ULSR − VLSR diagram, which according to Pauli et al. (2003) indicates indeed a thin-disk population. Kerber et al. (2004) classified S174 as a thin-disk population, while we classified the object as a probable thin-disk population. This is could be due to the different values of the proper motion, radial velocity and distance that were used by Kerber et al. (2004).
Galactic population classification of IPNe according to the Toomre and U − V diagrams.
Average kinematical parameters of IPNe located in the thin and thick Galactic disks.
Tabulated ratios of the mean critical, leading, and stopping densities (as defined in Sect. 5) to the ISM number density in the Galactic disk.
Table 4 shows the mean kinematical properties of the interacting planetary nebulae belonging to the Galactic thin disk and Galactic thick disk. As expected, the thin-disk populations are much closer to the Galactic plane than the thick-disk populations. The thin-disk objects have lower space velocity and lower velocity in the direction perpendicular to the Galactic plane compared to the thick-disk objects. The mean rotational velocity component of the thin-disk and thick-disk populations are in good agreement with the rotational velocity component of the Galactic thin-disk (⟨ V ⟩ = 214 km s-1) and thick-disk (⟨ V ⟩ = 185 km s-1) populations given by Edvardsson et al. (1993). The average space velocity of the whole sample is ⟨ VS ⟩ = 64.6 ± 10.5 km s-1. This value is consistent with the velocity value (60 km s-1) stated by Borkowski et al. (1990) and Dgani & Soker (1998) for the Galactic disk planetary nebulae. In addition, it agrees well with the average tangential velocity of white dwarfs, 67 ± 39 km s-1, found by Lee (1984). Reviewing Paper I, the thin-disk and thick-disk populations include planetary nebulae in different stages of interaction, such as WZO1, WZO2, WZO3, and WZO4.
5. Interaction of PNe with ISM
Smith (1976) presented the first theoretical model to study the interaction between the PNe and the ISM. He modified the so-called snow-plough model of Oort (1951) to apply a slowly moving PN through low-density ISM. He concluded that the nebular deceleration could move the CS from the PN geometric centre, but it takes more time than the PN lifetime. However, his treatment of the problem ignored the distortion of the nebular shell which occurs before the CS displacement stage. Isaacmann (1979) used the same model for PNe located near the Galactic centre where the medium is denser than that assumed by Smith and the relative velocities of PNe are higher. He reached the same results as Smith (1976), and showed that the nebular shell fades away before any disruption becomes noticeable.
The authors BSS (analytically) and SBS (numerically) concluded that the interaction becomes dominant when the density of the nebular shell drops below a critical density because of the nebular expansion (see Sect. 1). As a result, the signs of interaction should be easily observable during the late stages of the nebular evolution, when high ISM densities and/or large relative velocities are needed to explain PN asymmetries attributable to interaction with the ISM.
A turning point in understanding PN-ISM interaction was the discovery made by Rauch et al. (2000). Their observations show that the interaction could be present in young and middle-aged as well as old PNe. Villaver et al. (2003) performed 2D hydrodynamic simulations and suggested that the interaction starts during the asymptotic giant branch (AGB) phase. They found that high relative velocities, high ISM densities, or the presence of a magnetic field are not necessary to explain the observed asymmetries in the external shells of PNe. Furthermore, contrary to the BSS and SBS studies, the interaction is observable even during the very early stages of the PN phase. They predicted that the leading section of the PN is brightened by adopting low relative velocity (20 km s-1) and ISM density (0.1 cm-3), which agrees with the second phase of interaction proposed by BSS.
Recently, Wareing et al. (2007; hereafter WZO) presented 3D hydrodynamic simulations based on different densities and velocities of the ISM and different AGB mass loss rates. Their model begins from the slow AGB wind phase to the end of the PN phase. They classified the PNe-ISM interaction into four stages according to the strength of the interaction (see Paper I). They found that the IPNe evolve more quickly through these stages the faster they move through the ISM. Comparing the models of WZO and BSS, it can be seen that the first two stages of interaction, WZO1 and WZO2, are similar although WZO find they can occur earlier in the PN evolution than considered in the BSS model because of the pre-shaping during the AGB. Furthermore, the third and fourth stages, WZO3 and WZO4, are similar to the third stage suggested by BSS. In contrast to BSS, WZO claimed that the signs of ISM interaction can become apparent at a young age with an average ISM velocity. They also conclude that there is agreement with the Villaver et al. (2003) results using similar models, while they extended the study of the PN-ISM interaction to include the AGB phase and higher ISM velocity than used by Villaver et al. (2003).
Using the derived space velocities and the expansion velocities of IPNe that move in the Galactic disk, we can define the interaction criteria in the Galactic thin and thick disks. Suppose that a PN with a number density (nPN) is moving with a relative velocity to the ISM1, Vrel, (Vrel = VS + Ve), where Ve is the expansion velocity and VS is the space velocity, through the ISM with a number density (nISM) and at an isothermal sound speed (c). When the nebular density reaches the critical density, with (ncrit ≃ (Vrel/c)2nISM), the ISM pressure becomes comparable to the PN pressure. Although the interaction takes place, the nebular shell continues its expansion as its density is still larger than the density of the ISM. Because of the continuous decrease of the PNe density, the PN ram pressure becomes of the same order of the ISM dynamical pressure (nPN ≃ (Vrel/Ve)2nISM). At this time, the nebular shell expansion in the direction of motion is significantly slowed down, but it does not completely stop, i.e. VS ≫ Ve, for the PN. Thus, we can consider Vrel = VS. The nebular density at this time is slowed down but does not completely stop (nstop ≃ (VS/Ve)2nISM). After a while, the nebular expansion in the leading edge is completely halted because of the ISM resistance. At this time, the leading edge does not expand more (i.e. Ve = 0), its ram pressure vanishes, and the density in the leading edge reaches the value (nleading ≃ (VS/c)2nISM). Taking the average PN expansion velocity Ve = 20 km s-1 (Weinberger 1989) and the isothermal sound speed in the PN gas ~ 10 km s-1 for a typical temperature of 104 K of ISM, the interaction takes place when the PN number density is ~ 60nISM. The leading density becomes ~ 35nISM and the stopping density becomes ~ 10nISM. We repeat the same calculations for the thin-disk objects, thick-disk objects, and the whole disk using the observed expansion velocities and the derived space velocities. The results of the mean critical, leading, and stopping densities are presented in Table 5. In general, the results for the whole Galactic disk are slightly higher than those of BSS because of the higher mean space velocity of our sample.
6. Isothermal and adiabatic shock
As a PN moves supersonically inside the ISM, it creates a strong shock behind it. Soker et al. (1991) introduced two types of numerical models of thick shells moving through the ISM: the isothermal and adiabatic cases. When the PN-ISM interaction starts, the generated shock will increase the temperature of the interacting area. After a while it will drop again because of the radiative cooling process. It should be noted that the radiative cooling is normally quadratically proportional to the interstellar density and it is most efficient below 106 K (Mellema 1998). The cooling time (Tcool) is given by Dgani (2000) as Tcool = 100(Vrel/50)3/nISM, whereas the shock velocities in steady state are about 50 km s-1. This indicates that cooling needs more time for shock developed in low ISM density by fast moving PNe. The cooling will be effective when the flow time (Tflow) of shocked ISM around the PNe is longer than the cooling time. The flow time is defined as Tflow = R/Vrel, where (R) is the linear radius of the PN in km (Dgani 2000). Now, we define the ratio between the cooling time and the flow time to be η = Tcool/Tflow. The interacting PNe located in the Galactic thin disk are expected to have average speed (V ~ 40 km s-1, see Table 4) through the ISM, while those located in the Galactic thick disk move much faster with average velocity (V ~ 110 km s-1, see Table 4). Furthermore, in the thin disk the ISM density is higher than in the thick disk. Therefore Dgani (2000) suggest that the objects moving in the thin disk will have η < 1 and the flow will be isothermal, while objects moving in the thick disk will have η > 1 and the flow will be adiabatic. An example of the isothermal shock model is the nebula A35 that is moving through the ISM with a velocity of 32.7 km s-1. We assume that the nebula is moving through the warm neutral medium of nISM = 0.4 cm-3 at a distance 96 pc above the Galactic plane. The PN cooling time of ~ 110 yr is more than one order of magnitude smaller than the flow time of ~ 7400 yr of the shocked ISM. The nebula NGC 6826 is a good example of the adiabatic shock model. The object is moving with a velocity of 104 km s-1 at a distance 302 pc above the Galactic plane, where nISM = 0.075 cm-3 assuming it is located inside the warm neutral medium. The cooling time of ~ 16 000 yr is about one order of magnitude larger than the flow time of ~ 700 yr, therefore the ISM flow around the nebula is adiabatic.
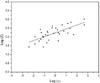 |
Fig. 3 Absolute value of the PNe height above the Galactic plane (Log Z) versus the ratio between the cooling time and the flow time η (with η = Tcool/Tflow, where Tcool and Tflow are defined as in Sect. 6). The value of the interstellar density (nISM) has been derived following Ferrière (2001). The solid line shows the linear correlation between both parameters (see text for details). |
Our results show that 20 objects of the sample follow the isothermal model. These objects belong to the thin-disk population IPNe, except PG1034+001 and S176 that belong to the thick-disk population. The rest of the sample (14 objects) follows an adiabatic model. These objects are classified as thick-disk populations, except two thin-disk populations (IC 4593, NGC 3587) and three probable thin-disk populations (A36, NGC 40, N6891). The results indicate that there is a tendency for the interaction between planetary nebulae and ISM in the thin disk to create isothermal shocks, while adiabatic shocks are more present in the thick disk. These findings match the Soker & Dgani (1997) theoretical expectations. Figure 3 shows that there is a linear correlation between the cooling-flow time ratio (log (η)) and the absolute height above the galactic plane (log (Z)) of IPNe. It also shows a tendency for PN-ISM interaction to create isothermal shocks for objects close to the galactic plane (Z < 160 pc) and adiabatic shocks for objects that lie at high galactic height (Z > 160 pc). Therefore, we could use this correlation to get a rough value of η for each particular Z, but statistically we require more data points to establish a solid correlation. The transition point between the isothermal and adiabatic cases (η = 1) in our sample lies at Z ~ 160 pc. This value should be taken with caution because again the number of data points is statistically low.
7. Conclusions
The motivation for this study was to determine the galactic population classification of planetary nebulae that are moving through the ISM, and to discuss the interaction shock model for each object. To achieve our goal the space coordinates and velocity components were calculated using the available proper motions, radial velocities, and distances of 34 IPNe. Two different kinematical tools were used to uncover the galactic thin and thick disk populations of IPNe. The results show that 16 IPNe are thin-disk populations, 7 are probably thin-disk populations, 10 are thick-disk populations, and one is a probable thick-disk population. Furthermore, we found that most of the PNe moving through the Galactic thin disk create isothermal shock, whilst those moving through the Galactic thick disk create adiabatic shock. This result confirms the claim of Soker & Dgani (1997).
We repeated the calculations of BSS (that are based on constant parameters for the space velocity and the expansion velocity) for the density at which the nebular gas pressure is comparable to the ISM gas pressure, the density in the interacting rim of PNe, and the density in the counterpart of the interacting rim using real parameters for the space velocities and the expansion velocities inside the thin and thick galactic disks. The results indicate that the critical, leading, and stopping densities are higher in the thick disk than the thin disk. Furthermore, our derived densities are slightly larger than those of BSS.
We ignored the local ISM velocity.
Acknowledgments
The authors thank the anonymous referee for his valuable comments, which improved the paper.
References
- Acker, A. 1978, A&AS, 33, 367 [NASA ADS] [Google Scholar]
- Acker, A., Ochsenbein, F., Stenholm, B., et al. 1992, Strasbourg ESO catalog of Galactic Planetary Nebulae (ESO publications), 1047 [Google Scholar]
- Acker, A., Fresneau, A., Pottasch, S. R., et al. 1998, A&A, 337, 253 [NASA ADS] [Google Scholar]
- Ali, A., Sabin, L., Snaid, S., et al. 2012, A&A, 541, 98 [Google Scholar]
- Barstow, M. A., Bannister, N. P., Holberg, J. B., et al. 2001, MNRAS, 325, 1149 [NASA ADS] [CrossRef] [Google Scholar]
- Benedict, G., McArthur, B. E., Napiwotzki, R., et al. 2009, AJ, 138, 1969 [NASA ADS] [CrossRef] [Google Scholar]
- Bensby, T., & Feltzing, S. 2010, IAUS, 265, 300 [NASA ADS] [Google Scholar]
- Bensby, T., Feltzing, S., & Lundstrom, I. 2003, A&A, 410, 527 [NASA ADS] [CrossRef] [EDP Sciences] [Google Scholar]
- Borkowski, K. J., Sarazin, C. L., & Soker, N. 1990, AJ, 360, 173 (BSS) [Google Scholar]
- Cazetta, J. O., & Maciel, W. J. 2001, Ap&SS, 277, 393 [NASA ADS] [CrossRef] [Google Scholar]
- Cudworth, K. M. 1974, AJ, 79, 1384 [NASA ADS] [CrossRef] [Google Scholar]
- Daub, C. T. 1982, ApJ, 260, 612 [NASA ADS] [CrossRef] [Google Scholar]
- Dehnen, W., & Binney, J. J. 1998, MNRAS, 298, 387 [NASA ADS] [CrossRef] [Google Scholar]
- Dengel, J., Hartl, H., & Weinberger, R. 1980, A&A, 85, 356 [NASA ADS] [Google Scholar]
- Dgani, R. 2000, ASPC, 199, 305 [NASA ADS] [Google Scholar]
- Dgani, R., & Soker, N. 1998, ApJ, 495, 337 [NASA ADS] [CrossRef] [Google Scholar]
- Dopita, M. A., & Sutherland, R. S. 2003, Astrophysics of the diffuse universe (Berlin, New York: Springer) [Google Scholar]
- Durand, S., Acker, A., & Zijlstra, A. 1998, A&AS, 132, 13 [NASA ADS] [CrossRef] [EDP Sciences] [Google Scholar]
- Edvardsson, B., Andersen, J., Gustafsson, B., et al. 1993, A&A, 275, 101 [NASA ADS] [Google Scholar]
- Faundez-Abans, M., & Maciel, W. J. 1987, A&A, 183, 324 [NASA ADS] [Google Scholar]
- Ferrière, K. M. 2001, RvMP, 73, 1031 [Google Scholar]
- Fich, M., Treffers, R. R., & Dahl, G. P. 1990, AJ, 1999, 622 [NASA ADS] [CrossRef] [Google Scholar]
- Fitzgerald, M. P. 1968, 73, 983 [Google Scholar]
- Gathier, R. 1987, A&A, 71, 245 [Google Scholar]
- Gathier, R., Pottasch, S. R., & Goss, W. M. 1986, A&A, 157, 191 [NASA ADS] [Google Scholar]
- Giammanco, C., Sale, S. E., Corradi, R. L. M., et al. 2011, A&A, 525, 58 [Google Scholar]
- Gieseking, F., Hippelein, H., & Weinberger, R. 1986, A&A, 156, 101 [NASA ADS] [Google Scholar]
- Good, S. A., Barstow, M. A., Burleigh, M. R., et al. 2005, MNRAS, 364, 1082 [NASA ADS] [CrossRef] [Google Scholar]
- Guerrero, M. A., Villaver, E., & Manchado, A. 1998, ApJ, 507, 889 [NASA ADS] [CrossRef] [Google Scholar]
- Gurzadyan, G. A. 1969, Planetary Nebulae (New York: Gordon & Breach) [Google Scholar]
- Gutiérrez-Moreno, A., Anguita, C., Loyola, P., et al. 1999, PASP, 111, 1163 [NASA ADS] [CrossRef] [Google Scholar]
- Harris, H. C., Dahn, C. C., Canzian, B., et al. 2007, AJ, 133, 631 [NASA ADS] [CrossRef] [Google Scholar]
- Hewett, P. C., Irwin, M. J., Skillman, E. D., et al. 2003, ApJ, 599, L37 [NASA ADS] [CrossRef] [Google Scholar]
- Hippelein, H., & Weinberger, R. 1990, A&A, 232, 129 [NASA ADS] [Google Scholar]
- Hog, E., Fabricius, C., Makarov, V. V., et al. 2000, A&A, 355, L27 [NASA ADS] [Google Scholar]
- Holberg, J. E., Barstow, M. A., & Sion, E. M. 1998, ApJS, 119, 207 [NASA ADS] [CrossRef] [Google Scholar]
- Jacoby, G. H. 1981, AJ, 244, 903 [Google Scholar]
- Johnson, D. R. H., & Soderblom, D. R. 1987, AJ, 93, 864 [NASA ADS] [CrossRef] [Google Scholar]
- Kaler, J. B., Mo, J.-E., & Pottasch, S. R. 1985, ApJ, 288, 305 [NASA ADS] [CrossRef] [Google Scholar]
- Kerber, F., Mignani, R. P., Pauli, E.-M., et al. 2004, A&A, 420, 207 [NASA ADS] [CrossRef] [EDP Sciences] [Google Scholar]
- Kerber, F., Mignani, R. P., Smart, R. L., et al. 2008, A&A, 479, 155 [NASA ADS] [CrossRef] [EDP Sciences] [Google Scholar]
- Kharchenko, N. V., & Roeser, S. 2009, VizieR On-line Data Catalog: I/280B [Google Scholar]
- Khromov, G. S. 1979, Afz, 15, 269 [NASA ADS] [Google Scholar]
- Lee, S.-G. 1984, AJ, 89, 720 [NASA ADS] [CrossRef] [Google Scholar]
- Lucke, P. B. 1978, A&A, 64, 367 [NASA ADS] [Google Scholar]
- Maciel, W. J. 1989, in Planetary Nebulae, ed. S. Torres-Peimbert (Dordrecht), IAU Symp., 131, 73 [Google Scholar]
- Maciel, W. J., & Dutra, C. M. 1992, A&A, 262, 271 [NASA ADS] [Google Scholar]
- Martin, J. 1994, Phys. Rev. D, 50, 7479 [NASA ADS] [CrossRef] [Google Scholar]
- Meaburn, J., Clayton, C. A., Bryce, M., et al. 1996, MNRAS, 281, L57 [NASA ADS] [CrossRef] [Google Scholar]
- Mellema, G. 1998, Ap&SS, 260, 203 [NASA ADS] [CrossRef] [Google Scholar]
- Mendez, R. H., Kudritzki, R. P., Herrero, A., et al. 1988, A&A, 190, 113 [NASA ADS] [Google Scholar]
- Monet, D. G., Levine, S. E., Canzian, B., et al. 2003, AJ, 125, 984 [NASA ADS] [CrossRef] [Google Scholar]
- Napiwotzki, R. 2001, A&A, 367, 973 [NASA ADS] [CrossRef] [EDP Sciences] [Google Scholar]
- Napiwotzki, R., & Schöenberner, D. 1995, A&A, 301, 545 [NASA ADS] [Google Scholar]
- Odenkirchen, M., & Brosche, P. 1992, Astron. Nachr., 313, 69 [NASA ADS] [CrossRef] [Google Scholar]
- Oort, J. H. 1951, in Problems of Cosmical Aerodynamics: UNESCO meeting jointly sponsored by the International Astronomical Union and the International Union of Theoretical and Applied Mechanics, 118 [Google Scholar]
- Pauli, E.-M., Napiwotzki, R., Altmann, M., et al. 2003, A&A, 400, 877 [NASA ADS] [CrossRef] [EDP Sciences] [Google Scholar]
- Peimbert, M. 1978, IAUS, 76, 215 [Google Scholar]
- Peimbert, M., & Torres-Peimbert, S. 1983, in Planetary Nebulae, ed. D. R. Flower (Dordrecht: Reidel), IAU Symp., 103, 233 [NASA ADS] [CrossRef] [Google Scholar]
- Pier, J. R., Harris, H. C., Dahn, C. C., et al. 1993, in Planetary nebulae, eds. R. Weinberger, & A. Acker (Dordrecht: Kluwer Academic Publ.), IAU Symp., 155, 175 [Google Scholar]
- Pottasch, S. R. 1980, A&A, 89, 336 [NASA ADS] [Google Scholar]
- Pottasch, S. R. 1983, IAUS, 103, 391 [Google Scholar]
- Pottasch, S. R. 1996, A&A, 307, 578 [Google Scholar]
- Quireza, C., Rocha-Pinto, H. J., & Maciel, W. J. 2007, A&A, 475, 217 [NASA ADS] [CrossRef] [EDP Sciences] [Google Scholar]
- Rauch, T., Furlan, E., Kerber, F., et al. 2000, ASPC, 199, 341 [NASA ADS] [Google Scholar]
- Rauch, T., Ziegler, M., Werner, K., et al. 2007, A&A, 470, 317 [NASA ADS] [CrossRef] [EDP Sciences] [Google Scholar]
- Roeser, S., Demleitner, M., & Schilbach, E. 2010, AJ, 139, 2440 [NASA ADS] [CrossRef] [Google Scholar]
- Sabbadin, F. 1986, A&AS, 64, 579 [NASA ADS] [Google Scholar]
- Shklovsky, I. S. 1956, Astron. Zh., 33, 315 [Google Scholar]
- Smith, H. Jr. 1971, AJ, 76, 193 [NASA ADS] [CrossRef] [Google Scholar]
- Smith, H. 1976, MNRAS, 175, 419 [NASA ADS] [Google Scholar]
- Soker, N., & Dgani, R. 1997, ApJ, 484, 277 [NASA ADS] [CrossRef] [Google Scholar]
- Soker, N., Borkowski, K. J., & Sarazin, C. L. 1991, AJ, 102, 1381 (SBS) [NASA ADS] [CrossRef] [Google Scholar]
- Stanghellini, L., Shaw, R. A., & Villaver, E. 2008, ApJ, 689, 194 [NASA ADS] [CrossRef] [EDP Sciences] [Google Scholar]
- Villaver, E., García-Segura, G., & Manchado, A. 2003, ApJ, 585, L49 [NASA ADS] [CrossRef] [Google Scholar]
- Wareing, C. J., Zijlstra, A. A., & O’Brien, T. J. 2007, MNRAS, 382, 1233 [NASA ADS] [CrossRef] [Google Scholar]
- Weinberger, R. 1989, A&AS, 78, 301 [NASA ADS] [Google Scholar]
- Wu, Zhen-Yu, Ma, Jun, Zhou, Xu, et al. 2011, AJ, 141, 104 [NASA ADS] [CrossRef] [Google Scholar]
- Zacharias, N., Monet, D. G., Levine, S. E., et al. 2005, VizieR On-line Data Catalog: I/297 [Google Scholar]
- Zacharias, N., Finch, C., Girard, T., et al. 2009, VizieR On-line Data Catalog: I/315 [Google Scholar]
- Zhang, C. Y. 1993, ApJ, 410, 239 [NASA ADS] [CrossRef] [Google Scholar]
All Tables
Galactic coordinate (l, b), weighted distance (D), weighted proper motion (PM), and weighted radial velocity (RV) of the IPNe sample.
Derived space coordinates (X,Y,Z), velocity components (U,V,W), total space velocities (VS), and peculiar velocities (Vp) of the IPNe sample.
Galactic population classification of IPNe according to the Toomre and U − V diagrams.
Average kinematical parameters of IPNe located in the thin and thick Galactic disks.
Tabulated ratios of the mean critical, leading, and stopping densities (as defined in Sect. 5) to the ISM number density in the Galactic disk.
All Figures
|
Fig. 1 Toomre diagram for the sample of interacting planetary nebulae. The x-axis represents the velocity component (V) in the direction of the galactic rotation, while the y-axis represents the velocity component defined by the galactic centre direction (U) and the direction perpendicular to the Galactic plane (W). All velocity components are corrected from LSR. The semi-circular lines indicate the constant total velocity in steps of 50, 70, 100, 150 km s-1. The error bars represent the standard deviation in velocity components for the IPNe with multiple determined distances. Regions I, II, and III refer to the objects with total velocities VS < 50 km s-1, 70 ≥ VS ≥ 50 km s-1, and VS > 70 km s-1, respectively. |
| In the text | |
|
Fig. 2 ULSR − VLSR velocity diagram for the interacting planetary nebulae sample. The dotted ellipses are the 1σ and 2σ contours. The objects located outside the 2σ contour belong to the thick-disk populations, those inside the 1σ contour are thin-disk populations, and those between the 1σ and 2σ contours are classified as thin or thick populations. The error bars are defined as in Fig. 1. |
| In the text | |
|
Fig. 3 Absolute value of the PNe height above the Galactic plane (Log Z) versus the ratio between the cooling time and the flow time η (with η = Tcool/Tflow, where Tcool and Tflow are defined as in Sect. 6). The value of the interstellar density (nISM) has been derived following Ferrière (2001). The solid line shows the linear correlation between both parameters (see text for details). |
| In the text | |
Current usage metrics show cumulative count of Article Views (full-text article views including HTML views, PDF and ePub downloads, according to the available data) and Abstracts Views on Vision4Press platform.
Data correspond to usage on the plateform after 2015. The current usage metrics is available 48-96 hours after online publication and is updated daily on week days.
Initial download of the metrics may take a while.