Fig. 2
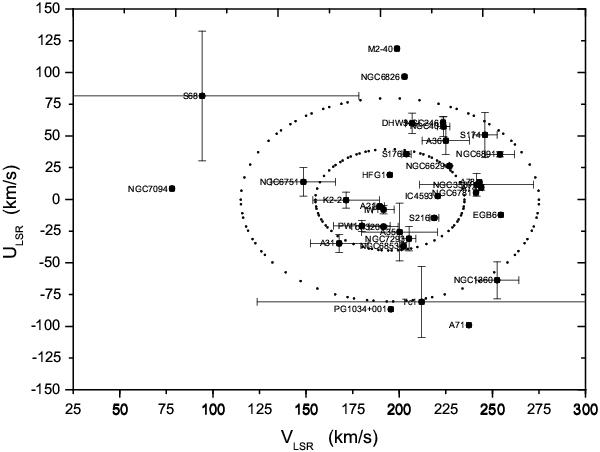
ULSR − VLSR velocity diagram for the interacting planetary nebulae sample. The dotted ellipses are the 1σ and 2σ contours. The objects located outside the 2σ contour belong to the thick-disk populations, those inside the 1σ contour are thin-disk populations, and those between the 1σ and 2σ contours are classified as thin or thick populations. The error bars are defined as in Fig. 1.
Current usage metrics show cumulative count of Article Views (full-text article views including HTML views, PDF and ePub downloads, according to the available data) and Abstracts Views on Vision4Press platform.
Data correspond to usage on the plateform after 2015. The current usage metrics is available 48-96 hours after online publication and is updated daily on week days.
Initial download of the metrics may take a while.