Fig. 1
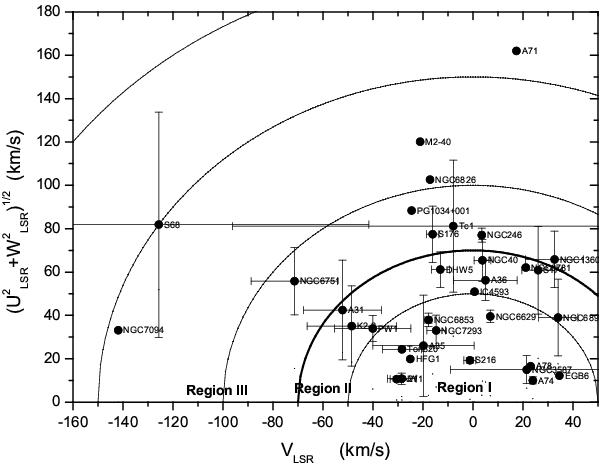
Toomre diagram for the sample of interacting planetary nebulae. The x-axis represents the velocity component (V) in the direction of the galactic rotation, while the y-axis represents the velocity component defined by the galactic centre direction (U) and the direction perpendicular to the Galactic plane (W). All velocity components are corrected from LSR. The semi-circular lines indicate the constant total velocity in steps of 50, 70, 100, 150 km s-1. The error bars represent the standard deviation in velocity components for the IPNe with multiple determined distances. Regions I, II, and III refer to the objects with total velocities VS < 50 km s-1, 70 ≥ VS ≥ 50 km s-1, and VS > 70 km s-1, respectively.
Current usage metrics show cumulative count of Article Views (full-text article views including HTML views, PDF and ePub downloads, according to the available data) and Abstracts Views on Vision4Press platform.
Data correspond to usage on the plateform after 2015. The current usage metrics is available 48-96 hours after online publication and is updated daily on week days.
Initial download of the metrics may take a while.