Fig. 8
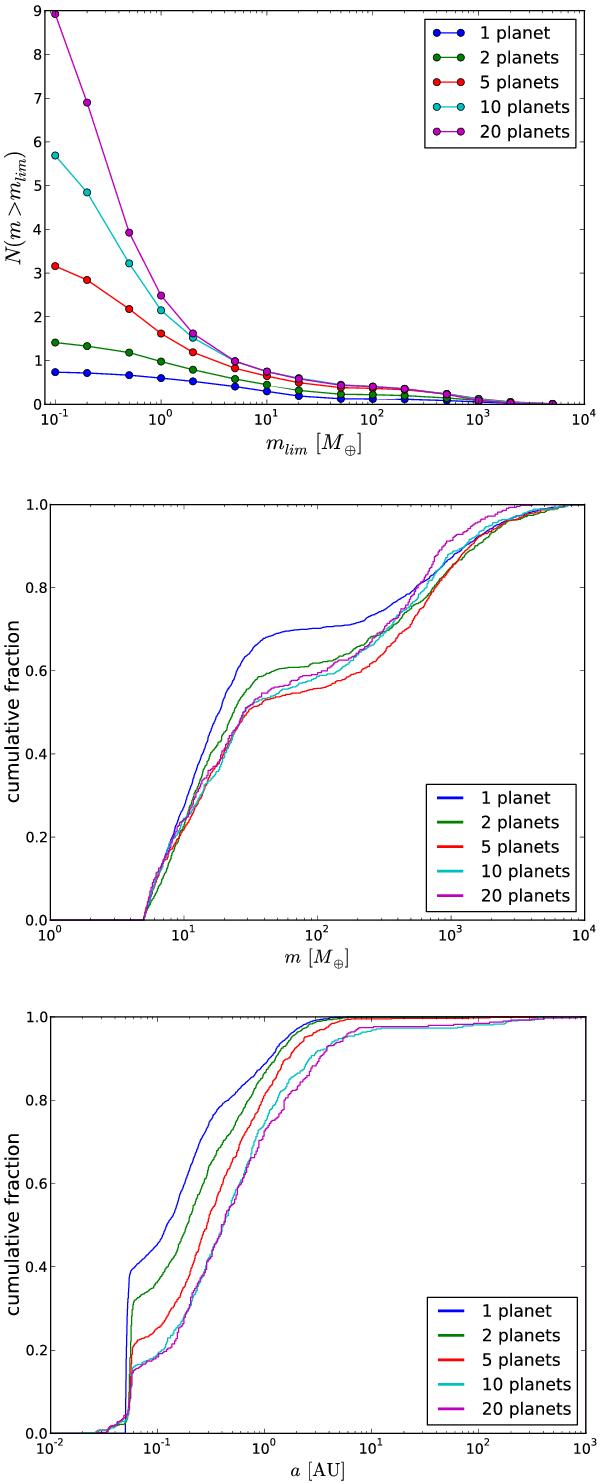
Top: mean number of planets per system that are more massive than a given value, for different simulations, assuming different numbers of planetary embryos initially present in the system. Middle: cumulative mass function, considering only planets more massive than 5 M⊕ still present in the system at the end of the simulation (planets colliding with the central star or ejected are not considered). Bottom: cumulative distribution of semi-major axis for the same population as in the middle panel. The number of planetary embryos assumed in each set of simulation is indicated on the panels. In the bottom panel, the planets that have been transported inside 0.05 AU by gravitational interactions with other planets of the same system.
Current usage metrics show cumulative count of Article Views (full-text article views including HTML views, PDF and ePub downloads, according to the available data) and Abstracts Views on Vision4Press platform.
Data correspond to usage on the plateform after 2015. The current usage metrics is available 48-96 hours after online publication and is updated daily on week days.
Initial download of the metrics may take a while.