| Issue |
A&A
Volume 558, October 2013
|
|
|---|---|---|
| Article Number | A26 | |
| Number of page(s) | 12 | |
| Section | Extragalactic astronomy | |
| DOI | https://doi.org/10.1051/0004-6361/201321685 | |
| Published online | 30 September 2013 | |
Vertical broad-line region structure in nearby active galactic nuclei
Institut für Astrophysik, Universität Göttingen, Friedrich-Hund Platz 1, 37077 Göttingen, Germany
e-mail: wkollat@astro.physik.uni-goettingen.de
Received: 11 April 2013
Accepted: 16 July 2013
Context. Broad emission lines are emitted in the surroundings of supermassive black holes in the centers of active galactic nuclei (AGN). This region is spatially not resolved.
Aims. We intend to get information on the structure and geometry of this broad emitting line region based on line profile observations.
Methods. We model the rotational and turbulent velocities in the line-emitting regions based on observed full-width at half maximum line values (FWHM) and σline of the variable broad emission lines in four nearby AGN: NGC 3783, NGC 7469, NGC 5548, and 3C 390.3. On the basis of these velocities, we estimate the height of the line-emitting regions above the midplane in context with their distances from the center.
Results. The Hβ lines are emitted in a more flattened configuration above the midplane in comparison to the highly ionized lines. The Hβ lines originate at heights of 0.7 to 1.6 light-days and at distances of 1.4 to 24 light-days with height/distance ratios (H/R) of only 0.07 to 0.5. The highly ionized lines originate at smaller radii than the Hβ lines and/or at greater distances above the midplane with H/R values of 0.2 to 1.7. In total, the emission lines do not originate in a thin atmosphere of an accretion disk but rather at very extended regions above an accretion disk. The observed geometries of the line-emitting regions resemble the geometries of accretion disk wind models. Furthermore, the angle of the central opening cone (generated by the emitting regions of the highly ionized lines) is small for those galaxies with slow rotational velocities and increases with the rotation velocity of the central region.
Conclusions. The derived geometries of the line-emitting regions of all four AGN are consistent with the geometries that are predicted in outflowing disk wind models.
Key words: accretion, accretion disks / line: profiles / galaxies: Seyfert / galaxies: active / galaxies: general / quasars: emission lines
© ESO, 2013
1. Introduction
It is now generally accepted that the emitted continuum flux in active galactic nuclei (AGN) is generated by accretion of matter onto a supermassive black hole. This central black hole is surrounded by an accretion disk (e.g., Lynden-Bell 1969). The broad optical/UV emission lines we see in the spectra of Seyfert 1 galaxies and/or quasars are caused by photoionization of the central ionizing source at distances of about 1 to 100 light-days from the center. These broad emitting line regions are spatially unresolved, even for the nearest AGN.
First pieces of information about the distances of the broad-line emitting regions from the central ionizing region have been obtained from the delayed variability of the integrated emission line intensities with respect to the ionizing continuum: the so-called reverberation mapping method (e.g., Cherepashchuk & Lytyi 1973; Clavel et al. 1991). Furthermore, the broad-line region (BLR) is stratified. The highly ionized lines originate closer to the central ionizing source than the lower ionized lines (e.g., Gaskell & Sparke 1986; Krolik et al. 1981; Korista et al. 1995; Peterson & Wandel 1999; Kollatschny 2001).
Individual delays of emission line segments (velocity delay maps) could be verified in a few cases. It has been shown that the BLR is gravitationally bound by means of the velocity-resolved reverberation mapping method (e.g., Gaskell 1988; Koratkar & Gaskell 1989, 1991a,b) with a slight inflow (see Gaskell & Goosmann 2013). Other studies found signatures of accretion disk winds (Kollatschny 2003; Bentz et al. 2010; Wang et al. 2011).
For a general review of our present knowledge of the structure of the BLR see Gaskell (2009). There exist various models regarding the geometry and structure of both accretion disks in AGN and accretion disk winds (e.g., Osterbrock 1978; Blandford 1982; Collin-Souffrin et al. 1988; Emmering et al. 1992; Königl & Kartje 1994; DeKool & Begelman 1995; Murray & Chiang 1997, 1998; Bottorff et al. 1997; Blandford & Begelman 1999; Elvis 2000; Proga et al. 2000; Proga & Kallman 2004; Kollatschny 2003, 2013a; Everett 2005; Ho 2008; Gaskell 2010; Goad et al. 2012; Flohic et al. 2012, and references therein). More direct evidence for a flattened BLR has come from the following three lines of evidence: (1) Wills & Browne (1986) showed that the full-width at half maximum (FWHM) of Hβ is strongly correlated with the orientation estimated from radio observations. (2) The reverberation mapping transfer functions of the low-ionization lines (Krolik et al. 1981; Horne et al. 1991) showed that there was little or no material on the line of sight and were consistent with a flattened disk. (3) Energy-budget requirements plus the absence of BLR absorption require the BLR to be flattened (Gaskell et al. 2007; Gaskell 2009).
The origin of the accretion disk winds is explained by radiation-driven winds or magnetocentrifugal winds. However, many details of the vertical BLR structure are still unknown.
The profiles of the broad emission lines in AGN can be parameterized by the ratio of their FWHM to their line dispersion σline. We demonstrated in two recent papers (Kollatschny & Zetzl 2011, hereafter Paper I; and Kollatschny & Zetzl 2013a, hereafter Paper II) that there exist general trends between the line width (FWHM) and the line width ratio FWHM/σline in these broad emission lines. Different emission lines exhibit different systematics in the FWHM/σline-vs.-FWHM diagram. The line width FWHM reflects the rotational motion of the broad-line gas in combination with associated turbulent motions. These turbulent velocities in the line-emitting regions are different for different emission lines. The rotational and turbulent velocities give us information on the accretion disk height with respect to the accretion disk radius of the line-emitting regions. We know the absolute numbers of the line-emitting radii from reverberation mapping. Therefore, one can get information on the absolute heights of the line-emitting regions above the accretion disks. In a third paper (Kollatschny & Zetzl 2013b, hereafter Paper III), we presented first results with regard to the BLR geometry of NGC 5548 based on their line profiles.
Here we present results on the BLR geometries of three new galaxies: NGC 3783, NGC 7469, and 3C 390.3. We know the profile parameters of at least four different emission lines in these galaxies, and we know in addition the distances of their line-emitting regions from the center based on former variability campaigns. On the basis of that information we are able to make statements about the geometry and structure of broad emission line regions in these AGN, which are emitting spectra with diverse line widths.
2. The data sample
The current investigation is based on the same sample of variable AGN spectra of Peterson et al. (2004) as in Papers I to III. The original AGN sample consisted of 37 galaxies. Variable broad emission lines of Hα, Hβ, Lyα, He ii λ4686, He ii λ1640, C iii] λ1909, C iv λ1550, and Si iv+O iv] λ1400 lines have been obtained with different ground-based telescopes, while the UV spectra were taken with the International Ultraviolet Explorer (IUE) and/or the Hubble Space Telescope during dedicated variability campaigns. This sample has the advantage that all the spectra were reduced in exactly the same way and that the spectra of each galaxy were intercalibrated with respect to each other.
For our analysis we use the mean as well as the root-mean-square (rms) profiles of the variable broad emission lines. Usually the observed broad-line profiles in AGN are more or less contaminated by additional narrow emission line components from the narrow line region. To avoid any major ambiguity we inspected only the rms line profiles out of the sample of Peterson (2004) (see Papers I to III). The rms profiles display the clean profiles of the variable broad emission lines. The narrow line components disappear in these spectra as they are constant over timescales of years. The emission line profiles in our AGN sample can be parameterized by their line widths FWHM and σline. The relationship between FWHM and σline contains information on the shape of the profile.
In Paper III we presented results on the BLR structure in NGC 5548 based on their optical/UV broad-line profiles. The optical/UV rms emission line profiles were based on two separated variability campaigns, while the Hβ line has been monitored over a period of 14 years. We use these data as comparison for the present investigation of the BLR structure of three further AGN. For the current investigation we selected all those AGN in the study of Peterson et al. (2004) where line profile data of at least four emission lines have been published: NGC 3783, NGC 7469, 3C 390.3.
The galaxy NGC 7469 has been the target of a large international variability campaign with ground-based telescopes in the optical and with the IUE satellite for the UV spectral lines. In 1996 from June 2 to July 30, optical spectrophotometric observations of NGC 7469 were completed (Collier et al. 1998) on 54 nights. From 1996 June 10 to July 29, the IUE satellite monitored the Seyfert 1 galaxy NGC 7469 continuously in an attempt to measure time delays between the UV continuum and the broad UV emission-line fluxes (Wanders et al. 1997).
The galaxy NGC 3783 has been the target of a large international variability campaign with ground-based telescopes in the optical and with IUE for the UV spectral lines. The Seyfert 1 galaxy NGC 3783 was monitored in the optical from 1991 December through 1992 August (Stirpe et al. 1994). It was observed with IUE at 69 epochs between 1991 December 21 and 1992 July 29 (Reichert et al. 1994).
The galaxy 3C 390.3 was monitored in a ground-based optical monitoring campaign from 1994 October through 1995 October (Dietrich et al. 1998). In parallel an extensive monitoring campaign was carried out with the IUE satellite from 1994 December 31 to 1996 March 5 (O’Brien et al. 1998). For the values of the line widths in 3C 390.3 (Table 1, Fig. 3) we used the unblended halfs of the emission lines (Peterson et al. 2004).
3. Results
We parameterize the observed rms line profiles in our galaxies by their line width FWHM as well as by the ratio of their FWHM to their line dispersion σline. This gives us information on the ratio of the accretion disk height with respect to the accretion disk radius of the line-emitting region. As we know the absolute numbers of the line-emitting radii from reverberation mapping studies, we are additionally able to make statements about the geometry and height of the broad emitting line regions above the midplane in different AGN. Here we present results for the three galaxies NGC 3783, NGC 7469, and 3C 390.3 and compare these findings with those of NGC 5548.
All spectral data we use in the current investigation are listed in Table 1. The Hβ line widths FWHM in our galaxies range from 2000 to 10 000 km s-1, the widths of C iv λ1549 range from 4300 to 9000 km s-1.
Line profile parameters as well as radii and heights above the midplane of the line-emitting regions of individual emission lines.
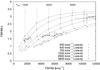 |
Fig. 1 NGC 7469: observed and modeled line width ratios FWHM/ σline versus line width FWHM. The dashed curves represent the corresponding theoretical line width ratios based on rotational line broadened Lorentzian profiles (FWHM = 200 to 3800 km s-1). The rotation velocities go from 1000 to 6000 km s-1 (curved dotted lines from left to right). |
3.1. Observed and modeled emission line width ratios
We present in Figs. 1 to 3 the observed line widths and line width ratios of the emission lines in NGC 7469, NGC 3783, 3C 390.3 as well as the related turbulent vturb and rotational velocities vrot of the line-emitting regions (see Papers I to III). It has been demonstrated by Goad et al. (2012) (see Paper II) that turbulent motions in the accretion disk produce Lorentzian profiles.
We have shown in Papers I and II that the ratio of the turbulent velocity vturb in the line-emitting region with respect to the rotational velocity vrot gives us information on the ratio of the accretion disk height H with respect to the accretion disk radius R of the line-emitting regions. By knowing the distances R of the line-emitting regions based on earlier reverberation mapping studies we are able to estimate the heights H of the line-emitting regions. We give in Table 1 the heights of the line-emitting regions in units of light-days as well as the ratio H/R for the individual emission lines in our galaxies.
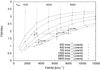 |
Fig. 2 NGC 3783: observed and modeled line width ratios FWHM/ σline versus line width FWHM. |
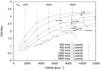 |
Fig. 3 3C 390.3: observed and modeled line width ratios FWHM/ σline versus line width FWHM. |
We demonstrated in Papers I and II that dedicated turbulent velocities belong to individual emission lines: we showed that there exist general trends between the line width FWHM and the line width ratio FWHM/σline of the individual broad emission lines. Different emission lines exhibit different systematics in this diagram. In a second step we modeled the observed trends. We could show that the shapes of the line profiles are caused by two dominant parameters: rotation and turbulent velocities. These turbulent velocities are different for the different emission lines. Additional small deviations from these general trends can be explained by additional inflow/outflow motions causing line asymmetries in individual galaxies, orientation effects of the line-emitting regions, optical thickness effects, etc.
Radii and heights of the line-emitting regions in units of the Schwarzschild radii of their central black holes for the galaxies NGC 7469, NGC 3783, and 3C 390.3.
As we did before for NGC 5548 (Paper III), we also calculate corrected heights of the line-emitting regions, which are based on the turbulent velocities belonging to the individual lines (see Paper II): 400 km s-1 for Hβ, 700 km s-1 for Hα, 900 km s-1 for He ii λ4686, 2100 km s-1 for Si iv+O iv] λ1400, 2300 km s-1 for He ii λ1640, 2900 km s-1 for C iv λ1549, and 3800 km s-1 for Lyα. The corrected heights Hcorr of the line-emitting regions, which are based on these vturb, are given in Table 1 as well.
The observed line widths FWHM of the individual emission lines occur over a large range (Table 1, Figs. 1, 2) in the Seyfert galaxies NGC 7469 and NGC 3783. The widths of their lines differ by a factor of 2.5 to 6. In contrast to the other galaxies, the line widths of the emission lines in 3C 390.3 (Table 1, Fig. 3) differ by a factor of 1.18 only. The radii of the line-emitting regions in 3C 390.3 (Table 1) also span a comparatively limited range. Another general trend has been noted before in other AGN that emit spectra with narrower line widths: namely, that the more highly ionized lines are broader in comparison to lower ionized lines and that they originate closer to the center (e.g., Shuder 1982; Gaskell & Sparke 1986; Krolik 1981; Kollatschny 2003). This trend is not to be seen in 3C 390.3.
3.2. Broad-line region geometries in NGC 7469, NGC 3783, and 3C 390.3 in comparison to NGC 5548
The BLR geometry in NGC 5548, which is based on two independent optical/UV variability campaigns, has been presented and discussed in Paper III. Different emission lines originate in different regions and at different distances from the center in NGC 5548. The distances of the emitting regions depend, among other things, on the luminosity of the central ionizing source. We connected the emitting regions of the individual emission lines by solid lines to demonstrate this effect (see Fig. 5 in Paper III). Furthermore, we could verify the general trend that more highly ionized lines originate in a more extended shell above the accretion disk, while Balmer lines originate in an independent region far closer to the accretion disk. Therefore it appears to be justified to connect the emitting line regions of the highly ionized lines to get an illustration of the BLR structure. We present the BLR structure of NGC 5548 in Figs. 4 and 5 so that we connect the line-emitting regions of the highly ionized lines separately for the two variability campaigns. The Balmer line-emitting regions are kept detached. The line-emitting regions based on the variability campaign in 1988/89 are given in blue and those of the variability campaign in 1993 are given in black. The highly ionized lines (i.e., the non-Balmer lines) are connected by a solid line. The dot at radius zero gives the size of a Schwarzschild black hole (with M = 6.7 × 10⁷ M⊙ taken from Peterson et al. 2004) multiplied by a factor of twenty. We make the assumption that the accretion disk structures are arranged symmetrically to the midplane. The two axes scale in Figs. 4 and 5 are linear in units of light-days. One light-day corresponds to a distance of 2.59 × 1015 cm. The axis on top of the figure gives the distance of the line-emitting regions from the center in units of the Schwarzschild radius. The left-hand diagrams (Figs. 4, 6, 8, 10) are given for the observed turbulent velocities vturb, while the right-hand diagrams (Figs. 5, 7, 9, 11) are shown for the average of the turbulent velocities belonging to the individual emitting line regions (see Papers I to III).
Optical/UV spectra were taken during one variability campaign only for the Seyfert galaxies NGC 7469 and NGC 3783, as well as for 3C 390.3. Insofar as we cannot connect emitting regions of individual lines we now combine the sites of all highly ionized lines in 3C 390.3, NGC 7469, and NGC 3783, similar to what we did in NGC 5548 (Figs. 4 and 5). These diagrams (Figs. 6−11) present their individual BLR structures as a function of distance to the center as well as height above the midplane. The line-emitting regions of the Balmer lines have been kept separately. The dots at radius zero give the corresponding sizes of their Schwarzschild black holes (taken from Peterson et al. 2004) multiplied by a factor of twenty. The numerical values of the Schwarzschild radii as well as line-emitting regions are shown in Tables 1 and 2. Furthermore, the optical continuum luminosities at 5100 Å (corrected for the contribution of the host galaxies: Bentz et al. 2013) are given for the individual variability campaigns of the AGN.
We present in Figs. 4 to 11 the broad emitting line geometries for observed as well as for corrected turbulent velocities (see Papers II, III). There are small differences in their particular geometries. However, the general trends in their structures are identical.
4. Discussion
The derived BLR structures of the three AGN NGC 7469, NGC 3783, and 3C 390.3 (Figs. 6 to 11) confirm trends in their emitting region geometry that have been noticed in NGC 5548 before (Paper III, Figs. 4 and 5): the more highly ionized lines originate closer to the central ionizing source and/or at larger distances above the midplane. The Balmer lines are emitted closer to the midplane in a more flattened configuration in comparison to the other emission lines. It should be emphasized that the individual emission lines do not originate at one single radius only but rather in an extended region, depending on the luminosity of the central ionizing source (see, e.g., Kollatschny 2003 and Paper III). However, besides these common trends in the geometries of the line-emitting regions, there are differences with respect to the individual galaxies.
4.1. Comparison of the broad-line region geometries in different Seyfert galaxies
We jointly present the BLR structures of NGC 7469, NGC 3783, NGC 5548 (two epochs), and 3C 390.3 (in units of light-days) in a single diagram in Figs. 12 and 13 for comparison of their geometries. The two axes scale are linear in units of light-days. The emitting regions of the highly ionized lines in the individual galaxies are connected by solid lines, as done in Figs. 4−11. The Hβ emitting line regions have been kept separately. We connect the Hβ emitting regions of NGC 5548 for the 13 observing epochs as done in Paper III. The Hβ emitting regions are drawn in red.
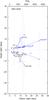 |
Fig. 4 NGC 5548 BLR structure as a function of distance to the center as well as height above the midplane for the two variability campaigns in 1988/89 (blue) and 1993 (black). The highly ionized lines are connected by a solid line. The Balmer lines are kept separately. The dot at radius zero gives the size of a Schwarzschild black hole (with M = 6.71 × 10⁷ M⊙) multiplied by a factor of twenty. |
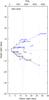 |
Fig. 5 NGC 5548 BLR structure − for the two variability campaigns in 1988/89 (blue) and 1993 (black). Same as Fig. 4, but based on corrected turbulent velocities vturb. |
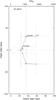 |
Fig. 6 3C 390.3 BLR structure. The highly ionized lines are connected by a solid line. Hβ has been kept separately. The dot at radius zero has the size of a Schwarzschild black hole (with M = 28.7 × 10⁷ M⊙) multiplied by a factor of twenty. |
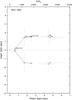 |
Fig. 8 NGC 7469 BLR structure as a function of distance to the center as well as height above the midplane. The highly ionized lines are connected by a solid line. The Balmer lines are kept separately. The dot at radius zero has the size of a Schwarzschild black hole (with M = 1.22 × 10⁷ M⊙) multiplied by a factor of twenty. |
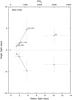 |
Fig. 10 NGC 3783 BLR structure. The highly ionized lines are connected by a solid line. Hβ has been kept separately. The dot at radius zero has the size of a Schwarzschild black hole (with M = 2.98 × 10⁷ M⊙) multiplied by a factor of twenty. |
Besides the fact that the emission line regions of the galaxies show different extensions in radius and originate at different heights above the midplane, there is a further systematic trend to be seen in these diagrams. This trend goes with the line widths FWHM (e.g., Hβ and/or C iv λ1549) of the galaxies. The “narrow” line Seyfert galaxies NGC 7469 and NGC 3783 show Hβ line widths (FWHM) of 2170 to 3100 km s-1 and C iv λ1549 line widths of 3690 to 4300 km s-1. NGC 5548 has Hβ line widths of 4040 to 8050 km s-1 and C iv λ1549 line widths of 6560 to 6870 km s-1 (Paper III). 3C 390.3 exhibits a Hβ line width of 9960 km s-1 and a C iv λ1549 line width of 8990 km s-1. The narrow line Seyferts NGC 7469 and NGC 3783 show narrower cone opening angles along the rotation axis concerning the highly ionized emitting line regions (in Figs. 12, 13) in comparison to the broad-line Seyferts NGC 5548 and 3C 390.3 As the line widths are related to the rotational velocities of the line-emitting regions, this sequence is one of increasing central rotation. Furthermore, the high-ionization lines of the broad-line Seyferts NGC 5548 and 3C 390.3 originate at larger radii further outside.
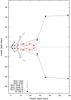 |
Fig. 12 BLR structures in NGC 7469, NGC 3783, NGC 5548 (two epochs), and 3C 390.3 as a function of distance to the center as well as height above the midplane. The highly ionized (non-Balmer) lines of the individual galaxies are connected by a solid line. The Hβ emitting regions are drawn in red. The Hβ emitting line regions of NGC 5548 (13 epochs) are connected by a solid red line. |
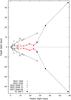 |
Fig. 13 BLR structures in NGC 7469, NGC 3783, NGC 5548 (two epochs), and 3C 390.3. Same as Fig. 12, but based on corrected turbulent velocities vturb. |
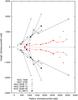 |
Fig. 14 BLR structures in NGC 7469, NGC 3783, NGC 5548 (two epochs), and 3C 390.3 scaled with respect to their individual Schwarzschild black hole radii (based on corrected turbulent velocities vturb). The emitting regions of the highly ionized lines of the individual galaxies are connected by a solid line. The Hβ emitting regions are drawn in red. Those of NGC 5548 are connected by a solid red line. The dot at radius zero gives the size of a black hole with 20 Schwarzschild radii. |
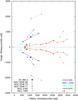 |
Fig. 15 BLR structures in NGC 7469, NGC 3783, NGC 5548 (two epochs), and 3C 390.3 scaled to their individual Schwarzschild black hole radii. Same as Fig. 14, but the emitting regions of the different lines are drawn in different colors: C iv λ1549 (blue), Si iv+O iv] λ1400 (black), He ii λ1640 (cyan), He ii λ4686 (green), Hβ (red). The individual line-emitting regions of the two narrow line Seyfert galaxies NGC 7469 and NGC 3783 are connected by a dashed line to aid the eye. The line-emitting regions of NGC 5548 are connected by a solid line. |
The Hβ emitting regions always occur at lower height-to-radius ratios (up to a factor of ten) and originate closer to the midplane than the high-ionization lines do. Based on theoretical models, Netzer (1990) has discussed that the high-ionization broad emission lines and most of the Lyα flux come from a spherical system above the midplane in comparison to the low-ionization lines (his Fig. 13). The height-to-radius ratio for Hβ is smallest for 3C 390.3 (with 0.07) and largest for the narrow line Seyferts NGC 7469 and NGC 3783 (0.33 and 0.50).
All high-ionization lines originate at larger radii in 3C 390.3 compared to the rest of the galaxies. Furthermore, the BLR structure of 3C 390.3 is different in one aspect in comparison to the other AGN: the Hβ line shows a smaller lag and broader Doppler width than the C iv λ1549 line. This has been noticed before by Peterson & Wandel (2000). The reported delay of 23.6 days (Dietrich et al. 1998) of the broad Hβ emission flux with respect to the optical continuum based on optical data for the years 1994/1995 was short-term in comparison to other variability campaigns of this galaxy. Other long-term spectral monitoring campaigns of this galaxy for the years 1995−2007 (Shapovalova et al. 2010; Popovic et al. 2011) and 1992−2000 (Sergeev et al. 2002) resulted in delays of about 90 days of the broad Hβ emission flux with respect to the optical continuum. The size relationship of the BLR structure in 3C 390.3 (Figs. 6, 7) would be very similar to that of the other galaxies (Figs. 4, 5, and 8−11) if the Hβ size were of the order of 80 light-days instead of 24 days. This size value would be more consistent with the results of Popovic et al. (2011). On the other hand, the derived radius of 24 light-days is consistent with the observed luminosity in the BLR size-luminosity relation (see Fig. 16). In a recent investigation, Dietrich et al. (2012) discussed the results of another variability campaign of 3C 390.3 in 2005. They determined a delay of 44 days for this campaign. The continuum luminosity was about 6× stronger than in 2005 compared to 1995, which is again consistent with the radius–luminosity relation of AGN. Dietrich et al. (2012) demanded a dedicated long-duration campaign of 3C 390.3 with densely sampled measurements to make firm statements about the Hβ size. To investigate whether 3C 390.3 is an exception with respect to the optical/UV line delays, it is necessary to carry out simultaneous C iv λ1549 and Hβ line variability studies in further broad-line/double-peaked AGN as well.
The overall picture we derived for the BLR structure before in NGC 5548 (Paper III) is strengthened by the emission line data of the galaxies NGC 7469, NGC 3783, and 3C 390.3. The Hβ line is emitted in a more flattened configuration above the midplane in comparison to the highly ionized lines. The Hβ lines originate at heights H of 0.7 to 1.6 light-days only and at distances R of 1.4 to 24 light-days from the center (see Figs. 12, 13). This corresponds to H/R values of 0.07 to 0.5 (Table 1) for the Hβ line-emitting regions. These values are upper limits of the geometrical heights of the associated accretion disks as they originate above the accretion disk. Additional contributions of outflowing wind components to the line widths would reduce the contribution of the turbulent velocities to the line profiles and thus reduce the numerical values of the geometrical heights.
The highly ionized lines originate at smaller radii than the Hβ lines and/or at greater distances from the midplane at H/R values of 0.2 to 1.7 (Table 1). Again, the same picture is confirmed (as seen before in NGC 5548) that the emission lines do not originate in a thin atmosphere of an accretion disk but rather in very extended regions above an accretion disk. This is in accordance with the BLR model presented by Gaskell (2009). The observed geometries of the line-emitting regions resemble the geometries of accretion disk wind models (e.g., Murray & Chiang 1997; Proga & Kallman 2004). There is a second trend to be seen when comparing the geometries of the different galaxies: the angle of the central opening cone (generated by the emitting regions of the highly ionized lines) is smaller for the galaxies with slow rotational velocities (based on their Hβ and/or C iv λ1549 line widths) and increases with the rotation.
4.2. Comparison of broad-line region geometries in different Seyfert galaxies scaled to their Schwarzschild radii
Now we investigate the question whether BLR structures in AGN are unambiguously characterized by their central black hole masses and by their central luminosities, which control the distances/radii of the line-emitting regions. We jointly present in Figs. 14 and 15 the BLR structures of our four AGN scaled to their individual Schwarzschild masses and therefore to the same black hole radii. Again these BLR structures are based on the observed high-ionization and Hβ emission lines. We use those black hole masses for calculating their Schwarzschild radii that were derived by Peterson (2004). These masses are still uncorrected regarding the contribution of the turbulent velocities to their line widths. Furthermore, the distances presented in Table 2 and Figs. 14, 15 were computed under the assumption that the geometrical scale factor f for calculating the central black hole masses MBH (Peterson et al. 2004) and their Schwarzschild radii is identical for all our galaxies:  (1)with τcent the characteristic distance of the line-emitting region, Δ v the emission line width, c the speed of light, and G the gravitational constant.
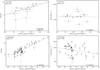 |
Fig. 16 Upper half: Hβ BLR size–luminosity relation for the NGC 5548 data over 13 years (see Paper III) as well as the corresponding FWHM(Hβ)–luminosity relation on the right side. Lower half: same as upper half for all AGN in the Peterson et al. (2004) sample (Paper I). |
However, the scale factor f in the formula depends on the structure, kinematics, and orientation of the BLR and is therefore different for all individual galaxies. For a discussion, see Peterson et al. (2004), Kollatschny (2003), Collin et al. (2006), Decarli et al. (2008), Goad et al. (2012) and references therein. Even for the average factor ⟨ f ⟩, diverse values are discussed ranging from f = 1 (McLure & Dunlop 2004) to f ~ 5.5 (Onken et al. 2004). The relative black hole masses and therefore their radii are incorrect on the order of a factor of a few in Figs. 14, 15.
The extensions of the broad emission line regions among themselves in all four AGN related to their Schwarzschild radii (Figs. 14, 15) are not that different in comparison to the real extensions in units of light-days (Figs. 12, 13). However, the general trends regarding the heights of the emitting regions above the midplane remain the same as seen before.
Figure 15 again shows a comparison of the BLR structures of our galaxies (based on their strongest emission lines and on their line widths) as a function of their central Schwarzschild radius. Here we connected the individual emission lines of the line-emitting regions of the narrow line galaxies NGC 7469 and NGC 3783 and the line-emitting regions of the two variability campaigns of NGC 5548. The line-emitting regions are drawn in different colors: C iv λ1549 (blue), Si iv+O iv] λ1400 (black), He ii λ1640 (cyan), He ii λ4686 (green), Hβ (red).
There is a clear trend that the BLR geometries in AGN are different for the individual galaxies as a function of their line widths. They are not simple scaled-up versions depending only on the central black hole mass. Besides the luminosity there is at least one other significant parameter: the rotational velocity of the central broad-line region. This parameter controls the height of the line-emitting regions above the midplane. Broader Hβ and/or C iv λ1550 lines scaled to the same Schwarzschild radius originate closer to the midplane than do narrower species.
4.3. Comparison of broad-line region geometries in different Seyfert galaxies scaled to their optical luminosities
It has been shown before that the distances of the line-emitting regions depend on the luminosities of the central ionizing sources (e.g., Koratkar & Gaskell 1991a; Dietrich & Kollatschny 1995; Kaspi et al. 2000; Peterson et al. 2002, 2004; Bentz et al. 2013). This BLR size-luminosity relation is shown separately for the Hβ line in NGC 5548 over 13 years (Fig. 16 upper left, Table 2 in this paper and Table 1 in Paper III) and for the Hβ line in all galaxies of the Peterson et al. (2004) sample (Fig. 16 lower left, Table 2 in this paper and supplementary information in Paper I). The continuum luminosities at 5100 Å given by Peterson et al. (2004) have been corrected for the contribution of their host galaxies (Bentz et al. 2013).
A strong correlation is known to exist between the Hβ BLR size and the continuum luminosity in NGC 5548 for different variability campaigns as well as for the AGN sample of the Peterson et al. (2004). We calculated the corresponding correlation coefficients (Pearson, Spearman, and Kendall) and probabilities for random correlations (see Table 3). More details regarding these coefficients can be found in Kollatschny et al. (2006). The slope α for the Hβ data in NGC 5548 is α = 0.49 in the Hβ BLR size–luminosity diagram (Fig. 16, upper left). For these calculations we did not take into account the two Hβ measurements with very large error bars (τ(Hβ) ≤ 10 days). The slope has a value of α = 0.517 when we consider all AGN in our sample (Fig. 16, lower left).
Correlation coefficients r (Pearson, Spearman, and Kendall) and probabilities P for random correlations for the Hβ BLR size−continuum luminosity relation as well as for the Hβ FWHM−continuum luminosity relation.
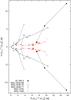 |
Fig. 17 BLR structures in NGC 7469, NGC 3783, NGC 5548 (two epochs), and 3C 390.3 scaled both to their individual continuum luminosities |
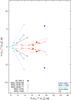 |
Fig. 18 BLR structures in NGC 7469, NGC 3783, NGC 5548 (two epochs), and 3C 390.3 scaled to their individual continuum luminosities |
For comparison we show the FWHM of Hβ as a function of their related optical continuum luminosities at 5100 Å on the right-hand side in Fig. 16. The FWHM are taken again from Peterson et al. (2004) and supplementary information in Paper I. In that case there is only a weak anticorrelation between the FWHM of Hβ and the ionizing continuum luminosity with a large scatter. In both cases the slope α is nearly flat: the slope for the NGC 5548 data alone is α = −0.014, and we get a slope of α = −0.085 for the whole AGN sample.
Now we investigate the question whether BLR structures in AGN are unambiguously characterized by their central luminosities, which control the distances/radii of the line-emitting regions. We jointly present in Figs. 17 and 18 the BLR structures of our four AGN scaled both to their individual continuum luminosities  and with respect to the continuum luminosity
  of NGC 3783. For this scaling relation, we took the value of α = 0.533 (from Bentz et al. 2013). Again, these BLR structures are based on the observed high-ionization as well as Hβ emission lines. The highly ionized lines (e.g., C iv λ1549) are always emitted in a far more extended region above the midplane in comparison to the Hβ lines, as seen before in Figs. 12 to 15. The C iv λ1549 line showing the greatest scale height is also the line for which Gaskell et al. (2007) found the highest covering factor, while they also found a relatively low covering factor for the Balmer lines. Reverberation mapping transfer functions of the low-ionization lines (Krolik et al. 1981; Horne et al. 1991) are consistent with a flattened disk geometry as well. In addition, one can see again that the BLR geometries in AGN are different for the individual galaxies as a function of their line widths (Fig. 18). This means that besides the luminosity there is at least one other significant parameter. This parameter is the line width and/or the rotational velocity of the central region and controls the height of the line-emitting regions above the midplane. Broader Hβ and/or C iv λ1550 lines originate closer to the midplane than do narrower species. We noticed this trend before when we scaled the BLR structures with respect to their Schwarzschild masses and radii (Fig. 15).
5. Conclusions
We investigate the BLR structures of four AGN that exhibit emission line profiles with different widths: the Hβ line widths FWHM range from 2000 to 10 000 km s-1. The Hβ lines are emitted in a more flattened configuration above the midplane in comparison to the highly ionized lines. The Hβ lines originate at heights of 0.7 to 1.6 light-days only above the midplane at distances of 1.4 to 24 light-days. The highly ionized lines originate at smaller radii than the Hβ lines and/or at greater distances from the midplane at H/R values of 0.2 to 1.7. In total the emission lines do not originate in a thin atmosphere of an accretion disk but rather in very extended regions above the midplane, as has been ascertained from other lines of evidence (Gaskell 2009). The observed geometries of the line-mitting regions resemble the geometries of accretion disk wind models. Furthermore, the angle of the central opening cone (generated by the emitting regions of the highly ionized lines) is small for the galaxies showing slow rotational velocities and increases with the rotation velocity.
Acknowledgments
Part of this work was supported by the German Deutsche Forschungsgemeinschaft, DFG project number Ko 857/32-1.
References
- Bentz, M. C., Horne, K., Barth, A. J., et al. 2010, ApJ, 720, L46 [NASA ADS] [CrossRef] [Google Scholar]
- Bentz, M. C., Denney, K. D., Grier, C. J., et al. 2013, ApJ, 767, 149 [NASA ADS] [CrossRef] [Google Scholar]
- Blandford, R. D., & Begelman, M. C. 1999, MNRAS, 303, L1 [NASA ADS] [CrossRef] [Google Scholar]
- Blandford, R. D., & Payne, D. G. 1982, MNRAS, 199, 883 [NASA ADS] [CrossRef] [Google Scholar]
- Bottorff, M. C., Korista, K. T., Shlosman, I., et al. 1997, ApJ, 479, 200 [NASA ADS] [CrossRef] [Google Scholar]
- Cherepashchuk, A. M., & Lytyi, V. M. 1973, ApL, 13, 165 [Google Scholar]
- Clavel, J., Reichert, Alloin, D. G. A., et al. 1991, ApJ, 366, 64 [NASA ADS] [CrossRef] [Google Scholar]
- Collier, S. J., Horne, K., Kaspi, S., et al. 1998, ApJ, 500, 162 [NASA ADS] [CrossRef] [Google Scholar]
- Collin, S., Kawaguchi, T., Peterson, B. M., & Vestergaard, M. 2006, A&A, 456, 75 [NASA ADS] [CrossRef] [EDP Sciences] [Google Scholar]
- Collin-Souffrin, S., Dyson, J. E., McDowell, J. C., & Perry, J. J. 1988, MNRAS, 232, 539 [NASA ADS] [CrossRef] [Google Scholar]
- Decarli, R., Labita, M., Treves, A., et al. 2008, MNRAS, 387, 1237 [NASA ADS] [CrossRef] [Google Scholar]
- DeKool, M., & Begelman, M. C. 1995, ApJ, 455, 448 [NASA ADS] [CrossRef] [Google Scholar]
- Dietrich, M., & Kollatschny, W. 1995, A&A, 303, 405 [NASA ADS] [Google Scholar]
- Dietrich, M., Peterson, B. M., Albrecht, P., et al. 1998, ApJS, 115, 185 [NASA ADS] [CrossRef] [Google Scholar]
- Dietrich, M., Peterson, B. M., Grier, C. J., et al. 2012, ApJ, 757, 53 [NASA ADS] [CrossRef] [Google Scholar]
- Elvis, M. 2000, ApJ, 545, 63 [NASA ADS] [CrossRef] [Google Scholar]
- Emmering, R. T., Blandford, R. D., & Shlosman, I. 1992, ApJ, 385, 460 [NASA ADS] [CrossRef] [Google Scholar]
- Eracleous, M., Halpern, J. P., & Livio, M. 1996, ApJ, 459, 89 [NASA ADS] [CrossRef] [Google Scholar]
- Everett, J. E. 2005, ApJ, 631, 689 [NASA ADS] [CrossRef] [Google Scholar]
- Flohic, H. M., Eracleous, M., & Bogdanovic, T. 2012, ApJ, 753, 133 [NASA ADS] [CrossRef] [Google Scholar]
- Gaskell, C. M. 1988, ApJ, 325, 114 [NASA ADS] [CrossRef] [Google Scholar]
- Gaskell, C. M. 2009, NewAR, 53, 140 [Google Scholar]
- Gaskell, C. M. 2010 [arXiv:1008.1057] [Google Scholar]
- Gaskell, C. M., & Goosmann, R. W. 2013, ApJ, 769, 30 [NASA ADS] [CrossRef] [Google Scholar]
- Gaskell, C. M., & Sparke, L. S. 1986, ApJ, 305, 175 [NASA ADS] [CrossRef] [Google Scholar]
- Gaskell, C. M., Klimek, E. S., & Nazarova, L. S. 2007 [arXiv:0711.1025] [Google Scholar]
- Goad, M. R., Korista, K. T., & Ruff, A. J. 2012, MNRAS, 426, 3086 [NASA ADS] [CrossRef] [Google Scholar]
- Ho, L. 2008, ARA&A, 45, 475 [NASA ADS] [CrossRef] [Google Scholar]
- Horne, K., Welsh, W. F., & Peterson, B. M. 1991, ApJ, 367, L5 [NASA ADS] [CrossRef] [Google Scholar]
- Kaspi, S., Smith, P. S., Netzer, H., et al. 2000, ApJ, 533, 631 [NASA ADS] [CrossRef] [Google Scholar]
- Königl, A., & Kartje, J. E. 1994, ApJ, 434, 446 [NASA ADS] [CrossRef] [Google Scholar]
- Kollatschny, W. 2003a, A&A, 407, 461 [NASA ADS] [CrossRef] [EDP Sciences] [Google Scholar]
- Kollatschny, W. 2003b, A&A, 412, L61 [NASA ADS] [CrossRef] [EDP Sciences] [Google Scholar]
- Kollatschny, W., & Zetzl, M. 2011, Nature, 470, 366 (Paper I) [NASA ADS] [CrossRef] [Google Scholar]
- Kollatschny, W., & Zetzl, M. 2013a, A&A, 549, A100 (Paper II) [NASA ADS] [CrossRef] [EDP Sciences] [Google Scholar]
- Kollatschny, W., & Zetzl, M. 2013b, A&A, 551, L6 (Paper III) [NASA ADS] [CrossRef] [EDP Sciences] [Google Scholar]
- Kollatschny, W., Bischoff, K., Robinson, E. L., et al. 2001, A&A, 379, 125 [NASA ADS] [CrossRef] [EDP Sciences] [Google Scholar]
- Kollatschny, W., Zetzl, M., & Dietrich, M. 2006, A&A, 454, 459 [NASA ADS] [CrossRef] [EDP Sciences] [Google Scholar]
- Koratkar, A. P., & Gaskell, C. M. 1989, ApJ, 345, 637 [NASA ADS] [CrossRef] [Google Scholar]
- Koratkar, A. P., & Gaskell, C. M. 1991a, ApJ, 375, 85 [NASA ADS] [CrossRef] [Google Scholar]
- Koratkar, A. P., & Gaskell, C. M. 1991b, ApJS, 75, 719 [NASA ADS] [CrossRef] [Google Scholar]
- Korista, K. T., Alloin, D., Barr, P., et al. 1995, ApJS, 97, 285 [NASA ADS] [CrossRef] [Google Scholar]
- Krolik, J., Horne, K., Kallman, T. R., et al. 1991, ApJ, 371, 541 [NASA ADS] [CrossRef] [Google Scholar]
- Lynden-Bell, D. 1969, Nature, 223, 690 [NASA ADS] [CrossRef] [Google Scholar]
- McLure, R. J., & Dunlop, J. S. 2004, MNRAS, 352, 1390 [NASA ADS] [CrossRef] [Google Scholar]
- Murray, N., & Chiang, J. 1997, ApJ, 474, 91 [NASA ADS] [CrossRef] [Google Scholar]
- Murray, N., & Chiang, J. 1998, ApJ, 494, 125 [NASA ADS] [CrossRef] [Google Scholar]
- Netzer, H. 1990, Saas-Fee Advanced Course 20, Lect. Notes 1990, eds. R. D. Blandford, H. Netzer, & L. Woltjer (Springer Verlag) [Google Scholar]
- O’Brien, P. T., Dietrich, M., et al. 1998, ApJ, 509, 163 [NASA ADS] [CrossRef] [Google Scholar]
- Onken, C. A., & Peterson, B. M. 2002, ApJ, 572, 746 [NASA ADS] [CrossRef] [Google Scholar]
- Onken, C. A., Ferrarese, L., Merritt, D., et al. 2004, ApJ, 615, 645 [NASA ADS] [CrossRef] [Google Scholar]
- Osterbrock, D. E. 1978, Proceedings of the National Academy of Sciences, 75, 540 [Google Scholar]
- Peterson, B. M., & Wandel, A. 1999, ApJ, 521, L95 [NASA ADS] [CrossRef] [Google Scholar]
- Peterson, B. M., & Wandel, A. 2000, ApJ, 540, L13 [NASA ADS] [CrossRef] [Google Scholar]
- Peterson, B. M., Berlind, P., Bertram, R., et al. 2002, ApJ, 581, 197 [NASA ADS] [CrossRef] [Google Scholar]
- Peterson, B. M., Ferrarese, L., Gilbert, K. M., et al. 2004, ApJ, 613, 682 [NASA ADS] [CrossRef] [Google Scholar]
- Popovic, L. C., Shapovalova, A. I., Ilić, D., et al. 2011, A&A, 528, 130 [Google Scholar]
- Proga, D., & Kallman, T. R. 2004, ApJ, 616, 688 [Google Scholar]
- Proga, D., Stone, J. M., & Kallman, T. R. 2000, ApJ, 543, 686 [NASA ADS] [CrossRef] [Google Scholar]
- Reichert, G. A., Rodriguez-Pascual, P. M., Alloin, D., et al. 1994, ApJ, 425, 582 [NASA ADS] [CrossRef] [Google Scholar]
- Sergeev, S. G., Pronik, V. I., Peterson, B. M., et al. 2002, ApJ, 576, 660 [NASA ADS] [CrossRef] [Google Scholar]
- Shapovalova, A. I., Popovic, L. C.,Burenkov, A. N., et al. 2010, A&A, 517, 42 [Google Scholar]
- Shuder, J. M. 1982, ApJ, 259, 48 [NASA ADS] [CrossRef] [Google Scholar]
- Stirpe, G. M., Winge, C., Altieri, B., et al. 1994, ApJ, 425, 609 [NASA ADS] [CrossRef] [Google Scholar]
- Wanders, I., Peterson, B. M., Alloin, D., et al. 1997, ApJS, 113, 69 [NASA ADS] [CrossRef] [Google Scholar]
- Wang, H., Wang, T., Zhou, H., et al. 2011, ApJ, 738, 85 [NASA ADS] [CrossRef] [Google Scholar]
- Wills, B. J., & Browne, I. W. A. 1986, ApJ, 302, 56 [NASA ADS] [CrossRef] [Google Scholar]
All Tables
Line profile parameters as well as radii and heights above the midplane of the line-emitting regions of individual emission lines.
Radii and heights of the line-emitting regions in units of the Schwarzschild radii of their central black holes for the galaxies NGC 7469, NGC 3783, and 3C 390.3.
Correlation coefficients r (Pearson, Spearman, and Kendall) and probabilities P for random correlations for the Hβ BLR size−continuum luminosity relation as well as for the Hβ FWHM−continuum luminosity relation.
All Figures
|
Fig. 1 NGC 7469: observed and modeled line width ratios FWHM/ σline versus line width FWHM. The dashed curves represent the corresponding theoretical line width ratios based on rotational line broadened Lorentzian profiles (FWHM = 200 to 3800 km s-1). The rotation velocities go from 1000 to 6000 km s-1 (curved dotted lines from left to right). |
| In the text | |
|
Fig. 2 NGC 3783: observed and modeled line width ratios FWHM/ σline versus line width FWHM. |
| In the text | |
|
Fig. 3 3C 390.3: observed and modeled line width ratios FWHM/ σline versus line width FWHM. |
| In the text | |
|
Fig. 4 NGC 5548 BLR structure as a function of distance to the center as well as height above the midplane for the two variability campaigns in 1988/89 (blue) and 1993 (black). The highly ionized lines are connected by a solid line. The Balmer lines are kept separately. The dot at radius zero gives the size of a Schwarzschild black hole (with M = 6.71 × 10⁷ M⊙) multiplied by a factor of twenty. |
| In the text | |
|
Fig. 5 NGC 5548 BLR structure − for the two variability campaigns in 1988/89 (blue) and 1993 (black). Same as Fig. 4, but based on corrected turbulent velocities vturb. |
| In the text | |
|
Fig. 6 3C 390.3 BLR structure. The highly ionized lines are connected by a solid line. Hβ has been kept separately. The dot at radius zero has the size of a Schwarzschild black hole (with M = 28.7 × 10⁷ M⊙) multiplied by a factor of twenty. |
| In the text | |
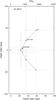 |
Fig. 7 3C 390.3 BLR structure. Same as Fig. 6, but based on corrected turbulent velocities vturb. |
| In the text | |
|
Fig. 8 NGC 7469 BLR structure as a function of distance to the center as well as height above the midplane. The highly ionized lines are connected by a solid line. The Balmer lines are kept separately. The dot at radius zero has the size of a Schwarzschild black hole (with M = 1.22 × 10⁷ M⊙) multiplied by a factor of twenty. |
| In the text | |
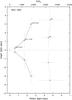 |
Fig. 9 NGC 7469 BLR structure. Same as Fig. 8, but based on corrected turbulent velocities vturb. |
| In the text | |
|
Fig. 10 NGC 3783 BLR structure. The highly ionized lines are connected by a solid line. Hβ has been kept separately. The dot at radius zero has the size of a Schwarzschild black hole (with M = 2.98 × 10⁷ M⊙) multiplied by a factor of twenty. |
| In the text | |
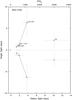 |
Fig. 11 NGC 3783 BLR structure. Same as Fig. 10, but based on corrected turbulent velocities vturb. |
| In the text | |
|
Fig. 12 BLR structures in NGC 7469, NGC 3783, NGC 5548 (two epochs), and 3C 390.3 as a function of distance to the center as well as height above the midplane. The highly ionized (non-Balmer) lines of the individual galaxies are connected by a solid line. The Hβ emitting regions are drawn in red. The Hβ emitting line regions of NGC 5548 (13 epochs) are connected by a solid red line. |
| In the text | |
|
Fig. 13 BLR structures in NGC 7469, NGC 3783, NGC 5548 (two epochs), and 3C 390.3. Same as Fig. 12, but based on corrected turbulent velocities vturb. |
| In the text | |
|
Fig. 14 BLR structures in NGC 7469, NGC 3783, NGC 5548 (two epochs), and 3C 390.3 scaled with respect to their individual Schwarzschild black hole radii (based on corrected turbulent velocities vturb). The emitting regions of the highly ionized lines of the individual galaxies are connected by a solid line. The Hβ emitting regions are drawn in red. Those of NGC 5548 are connected by a solid red line. The dot at radius zero gives the size of a black hole with 20 Schwarzschild radii. |
| In the text | |
|
Fig. 15 BLR structures in NGC 7469, NGC 3783, NGC 5548 (two epochs), and 3C 390.3 scaled to their individual Schwarzschild black hole radii. Same as Fig. 14, but the emitting regions of the different lines are drawn in different colors: C iv λ1549 (blue), Si iv+O iv] λ1400 (black), He ii λ1640 (cyan), He ii λ4686 (green), Hβ (red). The individual line-emitting regions of the two narrow line Seyfert galaxies NGC 7469 and NGC 3783 are connected by a dashed line to aid the eye. The line-emitting regions of NGC 5548 are connected by a solid line. |
| In the text | |
|
Fig. 16 Upper half: Hβ BLR size–luminosity relation for the NGC 5548 data over 13 years (see Paper III) as well as the corresponding FWHM(Hβ)–luminosity relation on the right side. Lower half: same as upper half for all AGN in the Peterson et al. (2004) sample (Paper I). |
| In the text | |
|
Fig. 17 BLR structures in NGC 7469, NGC 3783, NGC 5548 (two epochs), and 3C 390.3 scaled both to their individual continuum luminosities |
| In the text | |
|
Fig. 18 BLR structures in NGC 7469, NGC 3783, NGC 5548 (two epochs), and 3C 390.3 scaled to their individual continuum luminosities |
| In the text | |
Current usage metrics show cumulative count of Article Views (full-text article views including HTML views, PDF and ePub downloads, according to the available data) and Abstracts Views on Vision4Press platform.
Data correspond to usage on the plateform after 2015. The current usage metrics is available 48-96 hours after online publication and is updated daily on week days.
Initial download of the metrics may take a while.