Fig. 2

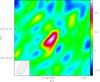
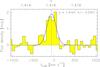
Left panel: 12CO(2−1) intensity map obtained with the IRAM PdBI toward AGN.1317. The color wedge of the intensity map is in Jy beam-1 km s-1. The black cross marks the coordinates of the phase tracking centre of our observations (see Table 1). The rms noise level is σ = 0.07 Jy beam-1 km s-1 and contour levels run from 3σ to 7σ with 1σ spacing. In this map a velocity range of ~360 km s-1 is used. The beam of 4 73 × 233 (PA = 147°) is plotted at lower left. Right panel: 12CO(2−1) integrated spectrum obtained with the IRAM PdBI toward AGN.1317 centred on the optical velocity of AGN.1317, Vopt = 4.25 × 10⁵ km s-1 (z = 1.4162, G10). The spectrum has a flux density (SCO) scale from − 0.7 to 2.2 mJy, a velocity scale from − 1050 to 1050 km s-1 (lower x-axis), and a z scale from 1.4128 to 1.4197 (upper x-axis). The Gaussian fit and the vertical dot-dashed line show that the 12CO(2−1) emission is blue-shifted by ~61 km s-1 with respect to the optical emission (G10).
Current usage metrics show cumulative count of Article Views (full-text article views including HTML views, PDF and ePub downloads, according to the available data) and Abstracts Views on Vision4Press platform.
Data correspond to usage on the plateform after 2015. The current usage metrics is available 48-96 hours after online publication and is updated daily on week days.
Initial download of the metrics may take a while.