Fig. 3
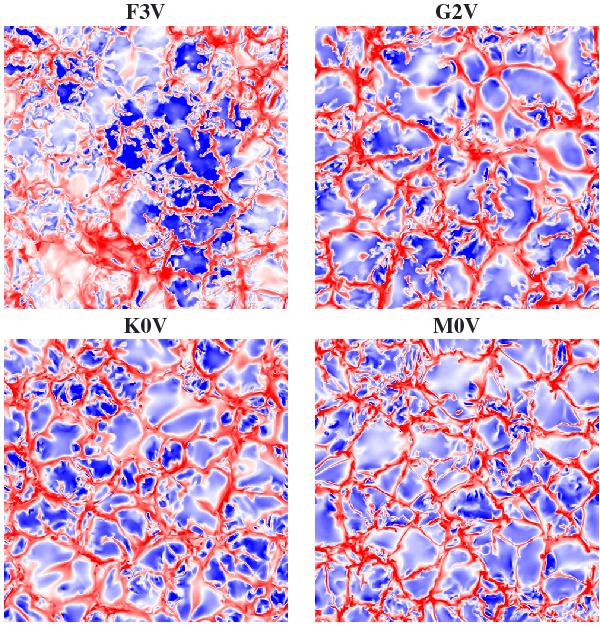
Maps of the vertical velocity υz at constant geometrical depth z0 = ⟨z(τR = 1) ⟩ (average level of the optical surface) for four of the six models. Upward motions are blue, downward motions are red, colour scales saturate at ± 2·υz,rms(z0) (for values, see Table 1). Note that the horizontal scales are different (cf. Fig. 2).
Current usage metrics show cumulative count of Article Views (full-text article views including HTML views, PDF and ePub downloads, according to the available data) and Abstracts Views on Vision4Press platform.
Data correspond to usage on the plateform after 2015. The current usage metrics is available 48-96 hours after online publication and is updated daily on week days.
Initial download of the metrics may take a while.