Fig. 2
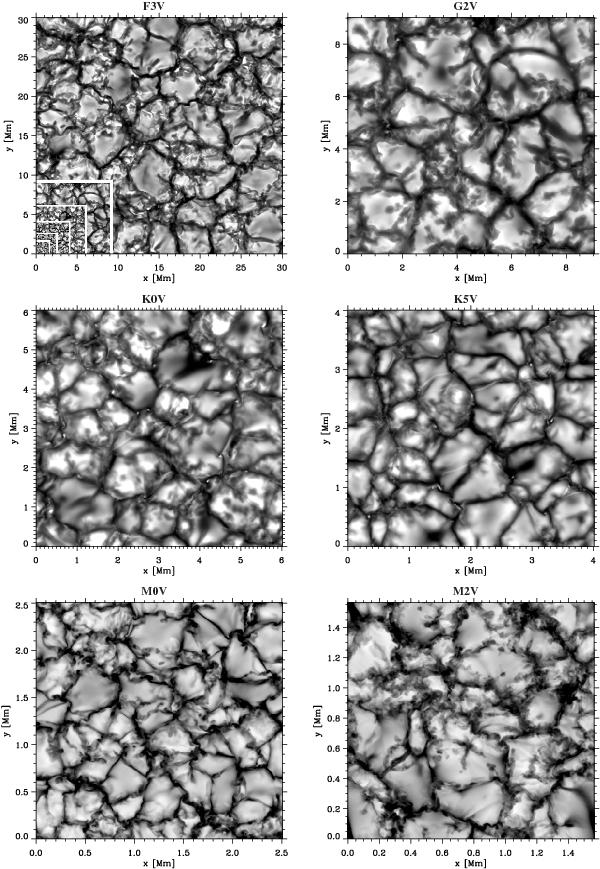
Maps of bolometric intensity emerging vertically from single snapshots of the six simulations. The grey scale of each image is saturated at ±2 σI, where σI is the rms contrast (cf. Table 1). The significant difference in the length scales of the images is illustrated by the inset in the upper left panel, which shows all other images on the same scale as the one from the F3V simulation.
Current usage metrics show cumulative count of Article Views (full-text article views including HTML views, PDF and ePub downloads, according to the available data) and Abstracts Views on Vision4Press platform.
Data correspond to usage on the plateform after 2015. The current usage metrics is available 48-96 hours after online publication and is updated daily on week days.
Initial download of the metrics may take a while.