Fig. 8
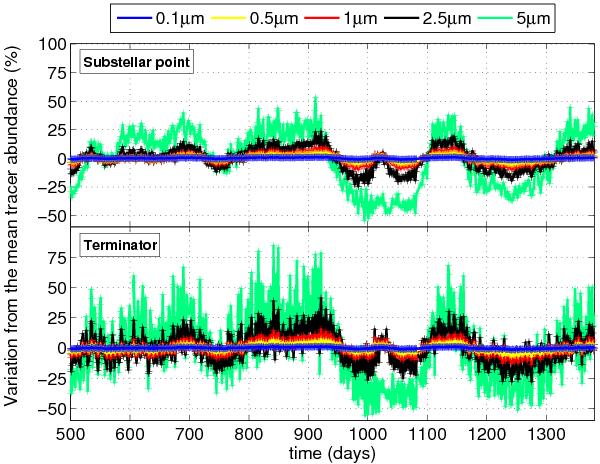
Time dependence of the mean tracer abundance averaged between 1mbar and 0.1mbar. The abundances are averaged horizontally over a circular region of radius 45° centered on the substellar point (top) and averaged horizontally around the terminator, including all regions within ± 5° of the terminator (bottom). The top panel is relevant for inferring the presence of a stratosphere (see Sect. 6.1), albedo variations (see Sect. 6.2) or secondary eclipse measurements (see Sect. 6.3). The bottom panel is relevant for transit spectroscopy measurements.
Current usage metrics show cumulative count of Article Views (full-text article views including HTML views, PDF and ePub downloads, according to the available data) and Abstracts Views on Vision4Press platform.
Data correspond to usage on the plateform after 2015. The current usage metrics is available 48-96 hours after online publication and is updated daily on week days.
Initial download of the metrics may take a while.