Free Access
Fig. 2
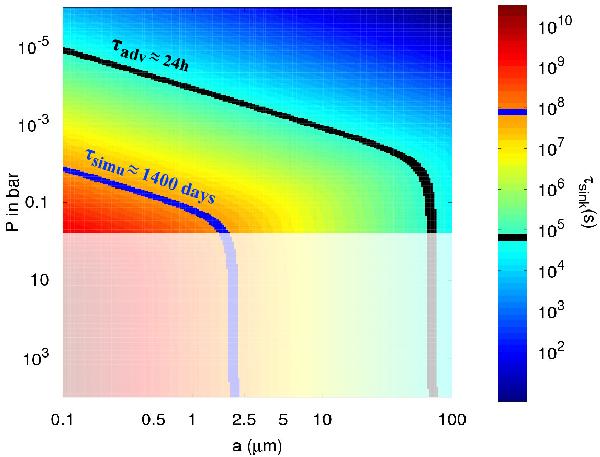
Settling timescale as a function of pressure and particle size for the same conditions as in Fig. 1. Also shown are the advective timescale (black curve) and the simulation timescale (blue curve). In the shaded region (below 1 bar), the tracers are considered gaseous and the settling timescale is not relevant for our study.
Current usage metrics show cumulative count of Article Views (full-text article views including HTML views, PDF and ePub downloads, according to the available data) and Abstracts Views on Vision4Press platform.
Data correspond to usage on the plateform after 2015. The current usage metrics is available 48-96 hours after online publication and is updated daily on week days.
Initial download of the metrics may take a while.