Fig. 14
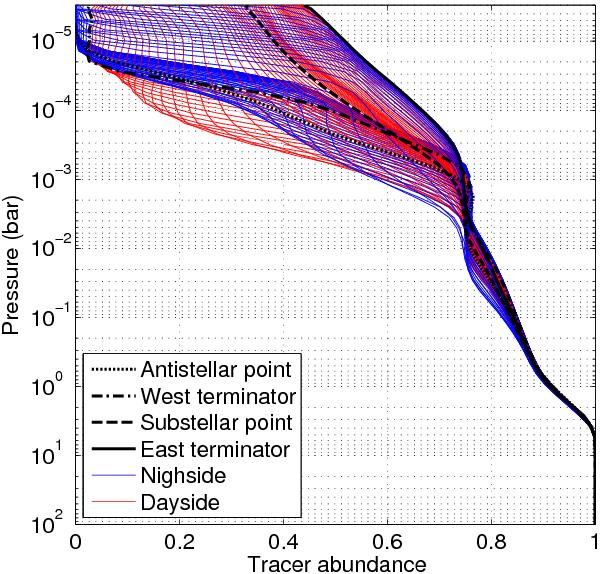
Time averaged tracer abundance along the equator for nightside condensate of 1 μm. The profiles are equally spaced in longitude by 2.8° The dayside profiles are in red whereas the nightside profiles are in blue. We highlight the profiles at the antistellar point (dotted line), the west terminator (dot-dashed line), the substellar point (dashed line) and the east terminator (plain line).
Current usage metrics show cumulative count of Article Views (full-text article views including HTML views, PDF and ePub downloads, according to the available data) and Abstracts Views on Vision4Press platform.
Data correspond to usage on the plateform after 2015. The current usage metrics is available 48-96 hours after online publication and is updated daily on week days.
Initial download of the metrics may take a while.