Fig. 2
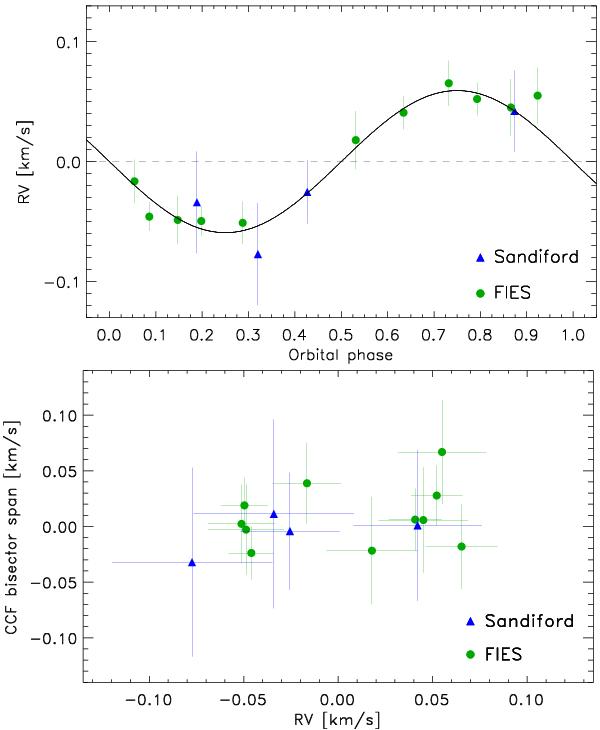
Upper panel: Sandiford and FIES radial velocities measurements of Kepler-77 and Keplerian fit to the data. The systemic velocities for each instrument, as derived from the global modelling of the data (Sect. 5 and Table 3), have been subtracted from the RV measurements. Lower panel: bisector spans of the Sandiford and FIES cross-correlation functions versus RV measurements, after subtracting the systemic velocities. The error bars in the CCF bisector spans are taken to be twice the uncertainties in the RV data.
Current usage metrics show cumulative count of Article Views (full-text article views including HTML views, PDF and ePub downloads, according to the available data) and Abstracts Views on Vision4Press platform.
Data correspond to usage on the plateform after 2015. The current usage metrics is available 48-96 hours after online publication and is updated daily on week days.
Initial download of the metrics may take a while.