Fig. 6
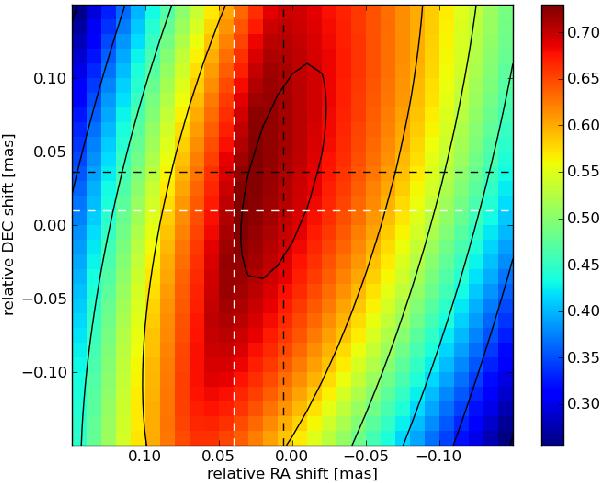
Distribution of the cross-correlation coefficient for the alignment of the 43 GHz and 22 GHz VLBI map. The intersection of the white dashed lines corresponds to the maximum cross-correlation coefficient in the color-map and the intersection of the dashed black line to the peak position of the fitted 2D Gaussian.
Current usage metrics show cumulative count of Article Views (full-text article views including HTML views, PDF and ePub downloads, according to the available data) and Abstracts Views on Vision4Press platform.
Data correspond to usage on the plateform after 2015. The current usage metrics is available 48-96 hours after online publication and is updated daily on week days.
Initial download of the metrics may take a while.