Fig. 5
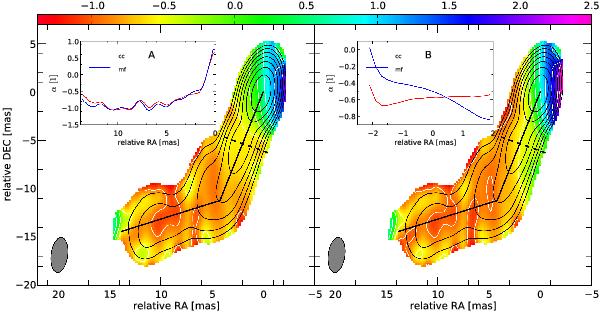
5 GHz–8 GHz spectral index maps for the May 2005 observations of CTA 102. The left panel shows the spectral index map produced by the 2D cross-correlation and the right panel the one by using the component based approach. The contours are drawn for the 8 GHz observations. The inlets show the distribution of the spectral index along the jet axis, black solid line, (inlet A) and transversal to the jet axis, dashed black line, (inlet B).
Current usage metrics show cumulative count of Article Views (full-text article views including HTML views, PDF and ePub downloads, according to the available data) and Abstracts Views on Vision4Press platform.
Data correspond to usage on the plateform after 2015. The current usage metrics is available 48-96 hours after online publication and is updated daily on week days.
Initial download of the metrics may take a while.