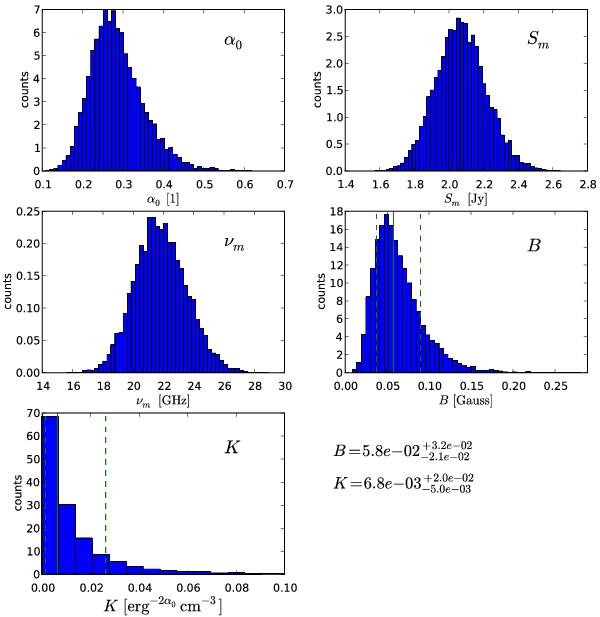
fig. D.3

Monte Carlo simulation results for magnetic field, B, and the normalization coefficient, K. The other panels show the distribution of the spectral parameters, which are used to calculate B and K. The solid green lines indicate the mean of the distribution and the dashed green lines one standard deviation. The values obtained for B and K are plotted in the lower right corner. Notice the asymmetric error bars and the tailed distribution for all parameters.
Current usage metrics show cumulative count of Article Views (full-text article views including HTML views, PDF and ePub downloads, according to the available data) and Abstracts Views on Vision4Press platform.
Data correspond to usage on the plateform after 2015. The current usage metrics is available 48-96 hours after online publication and is updated daily on week days.
Initial download of the metrics may take a while.


